Current Economic Statistics and Review For the
Week
Ended September 2, 2006
Theme
of the week:
Growing Income Inequality: India’s Experience in the Nineties*
"Issues of equity and social cohesion (are) issues that affect the very temperament of the country. We are forced to face the question of whether we will be able to go forward together as a unified society with a confident outlook or as a society of diverse economic groups suspicious of both the future and each other." William McDonough (Chairman, Federal Reserve Bank of New York, 1998)
Introduction
Popular opinion assumes a reduction in poverty and the bridging of income inequalities to be a direct consequence of, or rather analogous to, improved economic growth; yet, several instances of the contrary being true have given rise to a plethora of economic literature questioning the nature of the relationship between economic growth and reduced income inequalities. An analysis of data for the post-reform period in India confirms the conception that economic reforms lead to higher economic growth, yet as we extend the analysis, there are distinctive signs of increasing inequality in income distribution – though the absolute income levels have witnessed a rise for almost all employees, the gap between the relative incomes of the high-income and low-income groups seems to be widening. Within the framework of a liberalised economy, if the impact and extent of this increasing inequality is to be contained, there is a definitive case for social security measures in the form of both legislative interventions by the government as well as social responsibility initiatives by the private sector that has begun to play a direct and active role in the growth process.
I
Brief
Review of Literature
The nature of relationship between inequality and growth has remained debatable as many economists have put forward varied results. The starting point of the literature linking economic development and income inequality dates to the well-known works of two Nobel Prize winners, W.Arthur Lewis (1954) and Simon Kuznets (1955). Lewis, in his classic 1954 article “Economic Development with Unlimited Supplies of Labour,” developed a theoretical model in which growth and accumulation in a dual economy would start in the modern industrial sector, wherein capitalists would hire at a given wage and reinvest a share of their profits and the number of traditional agricultural labourers willing to move to this high-productivity, high-wage sector would be unlimited. In this process of development, and as long as these assumptions would prevail, inequality in the distribution of income would increase as average incomes rose. Eventually there would be a turning point after which inequality would fall as the surplus labor phase would come to an end and the dualistic economy would be replaced by a single-sector, fully industrialized economy. Although Kuznets did not explicitly model the inter-sectoral shifts of population as part of the development process, he did build on them to articulate his basic idea of an inverted-U relationship between economic growth and income inequality (the “Kuznets curve”). However, the data available at that time, and those used by Kuznets for empirical backing of his argument had several limitations and he was well aware of them, in his own words, “5 percent of empirical information and 95 per cent speculation, some of it possibly tainted by wishful thinking.” Kuznets based his speculation primarily on longitudinal data and called for in-depth case studies of the economic growth of nations. But many subsequent studies simply used aggregate cross-country data (often not particularly of high quality) and reduced-form models to explore and support the hypothesis of an inevitable trade off between economic growth and equity.
In the post-reform period, it has been typically argued that the chain of causation runs from economic growth to inequality. Economic reforms and the consequent higher economic growth have led to enhancements in capital accumulation which, in turn, are occasioned by better returns to capital and a shift in the remuneration structure from labour to capital at least in the initial phases of reforms. But there is ample reason to believe that the causality might be from inequality to growth as well, Persson and Tabellini (1993) propose that inequality is harmful to growth. But Fishlow (1995) finds no such link in case of Latin American countries; on the other hand, Bruno, Ravallion and Squaire (1996) conclude “initial distribution matters to the extent of nature of subsequent growth”. Redistributive policies that increase people’s access to credit markets and their opportunity to invest, for example, would contribute to grow.
In
case of
II
Macroeconomic Performance
The
Indian economy has continued to display significant improvements in
macroeconomic parameters and is being considered to be among the top
growing economies of the world second only to
|
Table
1: Broad Macroeconomic Indicators (in
per cent) |
|||||||||
|
|
1980-81 |
1990-91 |
1995-96 |
2000-01 |
2001-02 |
2002-03 |
2003-04 |
2004-05 |
2005-06 |
|
GDP
at factor cost (1993-94=100)* |
7.2 |
5.6 |
7.3 |
4.4 |
5.8 |
3.8 |
8.5 |
7.5 |
8.4 |
|
GNP
at factor cost (base year =1993-94)* |
7.3 |
5.5 |
7.5 |
4 |
5.9 |
3.9 |
8.6 |
7.6 |
8 |
|
PCI
at net national product at constant prices (in
Rupees) |
5352 |
7321 |
- |
16223 |
16910 |
17281 |
18517 |
19649 |
21005 |
|
Inflation
(WPI) (point-to-point) (1993-94=100)** |
16.7 |
12.7 |
4.4 |
5.5 |
1.6 |
6.5 |
4.6 |
5.1 |
4.1 |
|
Food
grains production |
18.1 |
3.1 |
-5.8 |
-6.2 |
8.1 |
-17.9 |
22.1 |
-4.2 |
2.3 |
Savings
and Investments
|
|
|
|
|
|
|
|
|
|
|
Gross
domestic savings |
21.2 |
24 |
25.1 |
23.5 |
23.6 |
26.5 |
28.9 |
29.1 |
- |
|
Gross
domestic investments |
22.7 |
27.4 |
26.9 |
24.2 |
23.0 |
25.3 |
27.2 |
30.1 |
- |
|
|
|
|
|
|
|
|
|
|
|
|
Sectoral
GDP # |
|
|
|
|
|
|
|
|
|
|
Agriculture,
forestry and fishing |
12.9 |
4.6 |
-0.9 |
0 |
6.2 |
-6.9 |
10 |
0.7 |
3.9 |
|
Industry |
3 |
6.3 |
11.6 |
6.3 |
2.7 |
7 |
7.6 |
8.6 |
8.7 |
|
Services |
4.3 |
4.4 |
10.5 |
5.6 |
7.1 |
7.3 |
8.2 |
9.9 |
10 |
|
|
|
|
|
|
|
|
|
|
|
|
Social
Indicators |
|
|
|
|
|
|
|
|
|
|
Population
(in Million) |
679 |
839 |
- |
1019 |
1038 |
1055 |
1073 |
1090 |
|
|
Life
expectancy at birth (in years) |
50.4 |
58.7 |
- |
|
- |
- |
- |
- |
- |
|
Literacy
rate |
43.57 |
52.2 |
- |
65.38 |
- |
- |
- |
- |
- |
|
Note:*From
2000-01 the new series with base year 1999-00 |
|
|
|
|
|
|
|
||
|
**
Data for 1980-81 and 1990-91 relate to base year 1981-82) |
|
|
|
|
|
|
|
||
|
|
|||||||||
|
-'
implies data not available. |
|
|
|
|
|
|
|
|
|
|
Source:
Economic Survey, various issues |
|
|
|
|
|
|
|
|
|
The decadal GDP growth rates for 1980s (1980-81 to 1991-92) and 1990s (1992-93 to 2001-02) have worked out to 5.5 per cent and 6.1 per cent, respectively. Further, the economic growth rate has been hovering around 8 per cent since 2003-04. Similarly, per capita net national product (at 1993-94 prices) has risen from Rs 7,321 in 1990-91 to Rs 10,308 in 2000-01 and further to Rs 21,005 in 2005-06, showing a substantial increase in purchasing power in the hands of people. The savings and investment rates have also shown gradual increases except in the recessionary years of 2000-01 and 2001-02. The social indicators in terms of life expectancy and literacy rate, though they have not showed a very optimistic performance during the last few decades, albeit there has been some progress. Apparently, the Indian economy is on the high growth trajectory as exhibited by these broad macro economic indicators.
III
Empirical
Analysis for 1990s and Thereafter
Consumption
Expenditure
In
recent years, the relationship between income distribution and the
process of development has come increasingly come under scrutiny. As
mentioned above, there are no empirical evidences to establish firm
correlation between these two parameters given the problems associated
with the data availability. Yet, some indicators such as trends in
consumption expenditure by various sections of the society portray the
extent of income inequality in the country (Table 2). It is understood
that the prospect of declining income shares of the lower income groups
raises obvious questions about the welfare aspects of development.
Interestingly, the data released by UNDP disseminates revealing results,
which show that the share of consumption of the richest 10 and 20 per
cent to the poorest 10 and 20 per cent, respectively in
Table
2: Indicators of Income Inequality: Consumption Expenditure
|
||||||
|
|
|
|
||||
|
|
Survey
Period |
|||||
|
|
1997 |
1999-00 |
1996-2002 |
1998 |
2001 |
1996-2002 |
|
Share
of consumption |
|
|
|
|
|
|
|
Poorest
10 per cent |
3.5 |
3.9 |
- |
2.4 |
1.8 |
- |
|
Poorest
20 per cent |
8.1 |
8.9 |
8.9 |
5.9 |
4.7 |
4.7 |
|
Richest
20 per cent |
46.1 |
41.6 |
- |
46.6 |
50 |
- |
|
Richest
10 per cent |
33.5 |
27.4 |
- |
30.4 |
33.1 |
- |
|
Measures
of Inequality |
|
|
|
|
|
|
|
Richest
10 per cent to poorest 10 per cent |
9.5 |
7.0 |
- |
12.7 |
18.4 |
- |
|
Richest
20 per cent to poorest 20 per cent |
5.7 |
4.7 |
4.9 |
8 |
10.7 |
10.7 |
|
Gini
index * |
37.8 |
32.5 |
32.5 |
40.3 |
44.7 |
44.7 |
|
Notes:
* Measures inequality over the entire distribution of
consumption expenditure where a value of 0 and 100 represents
perfect equality and perfect inequality, respectively. |
||||||
|
Source:
UNDP, Human Development Report, various issues |
|
|
||||
Poverty
Another significant indicator of income distribution is the estimated of trends in poverty in terms of headcount ratio, that is, the proportion of population below poverty line (Table 3). Poverty trends in India have been a matter of intense controversy in the nineties as the extent of actual decline in the proportion of population below the poverty line between 1993-94 and 1999-2000 has been a subject of intense debate by academicians due to changes in the methodology for collection of basic data in 1999-2000 and possible non-comparability with earlier rounds of the consumer expenditure survey conducted by National Sample Survey Organisation (NSSO). In the absence of conclusive evidence, widely divergent claims have flourished. Some have argued that the nineties have been a period of unprecedented improvement in living standards. Other have claimed that it has been a time of wide spread impoverishment. Clearly, as per the Planning Commission, the headcount ratio has declined significantly from 1980s to 1990s and further in 2000. The broad picture shows that there has been a sustained decline in poverty in most of the states during the reference period.
|
Table
3: Poverty Estimation: State-wise
Headcount Ratio |
||||||||
|
|
1983 |
1987-88 |
1993-94 |
1999-00 |
Adjusted
poverty |
|||
|
State/Uts |
|
|
|
Rural |
Urban |
Combined |
Ratios: |
|
|
|
|
|
|
|
|
|
55
th Round |
|
|
|
|
|
|
|
|
|
(1999-2000) |
|
|
|
|
|
|
|
|
|
Rural |
Urban |
|
(1) |
(2) |
(3) |
(4) |
(5) |
(6) |
(7) |
(8) |
(9) |
|
All
|
44.48 |
38.86 |
35.97 |
27.09 |
23.62 |
26.10 |
30.2 |
24.7 |
|
Andhra
Pradesh |
28.91 |
25.86 |
22.19 |
11.05 |
26.63 |
15.77 |
14.9 |
27.7 |
|
Arunachal
Pradesh |
40.88 |
36.22 |
39.35 |
40.04 |
7.47 |
33.47 |
- |
- |
|
|
40.47 |
36.21 |
40.86 |
40.04 |
7.47 |
36.09 |
44.1 |
8.3 |
|
|
62.22 |
52.13 |
54.96 |
44.30 |
32.91 |
42.60 |
49.2 |
33.8 |
|
|
18.90 |
24.52 |
14.92 |
1.35 |
7.52 |
4.40 |
|
|
|
|
32.79 |
31.54 |
24.21 |
13.17 |
15.59 |
14.07 |
15.4 |
16.0 |
|
Haryana |
21.37 |
16.64 |
25.05 |
8.27 |
9.99 |
8.74 |
12.7 |
9.5 |
|
Himachal
Pradesh |
16.40 |
15.45 |
28.44 |
7.94 |
4.63 |
7.63 |
18.9 |
4.5 |
|
|
24.24 |
23.82 |
25.17 |
3.97 |
1.98 |
3.48 |
|
|
|
Karnataka |
38.24 |
37.53 |
33.16 |
17.38 |
25.25 |
20.04 |
25.7 |
25.5 |
|
Kerala |
40.42 |
31.79 |
25.43 |
9.38 |
20.27 |
12.72 |
12.6 |
18.7 |
|
Madhya
Pradesh |
49.78 |
43.07 |
42.52 |
37.06 |
38.44 |
37.43 |
36.4 |
37.9 |
|
|
43.44 |
40.41 |
36.86 |
23.72 |
26.81 |
25.02 |
29.2 |
28.1 |
|
Manipur |
37.02 |
31.35 |
33.78 |
40.04 |
7.47 |
28.54 |
- |
- |
|
Meghalaya |
38.81 |
33.92 |
37.92 |
40.04 |
7.47 |
33.87 |
- |
- |
|
Mizoram |
36.00 |
27.52 |
25.66 |
40.04 |
7.47 |
19.47 |
- |
- |
|
Nagaland |
39.25 |
34.43 |
37.92 |
40.04 |
7.47 |
32.67 |
- |
- |
|
Orissa |
65.29 |
55.58 |
48.56 |
48.01 |
42.83 |
47.15 |
47.3 |
41.4 |
|
|
16.18 |
13.20 |
11.77 |
6.35 |
5.75 |
6.12 |
5.9 |
6.3 |
|
Rajasthan |
34.46 |
35.15 |
27.41 |
13.74 |
19.85 |
15.28 |
19.6 |
22.8 |
|
|
39.71 |
36.06 |
41.43 |
40.04 |
7.47 |
36.55 |
|
|
|
Tamil
Nadu |
51.66 |
43.39 |
35.03 |
20.55 |
22.11 |
21.12 |
19.9 |
24.4 |
|
Tripura |
40.03 |
35.23 |
39.01 |
40.04 |
7.47 |
34.44 |
- |
- |
|
Uttar
Pradesh |
47.07 |
41.46 |
40.85 |
31.22 |
30.89 |
31.15 |
33.7 |
30.4 |
|
|
54.85 |
44.72 |
35.66 |
31.85 |
14.86 |
27.02 |
37.1 |
19.5 |
|
Andaman
& Nicobar |
52.13 |
43.89 |
34.47 |
20.55 |
22.11 |
20.99 |
- |
- |
|
|
23.79 |
14.67 |
11.35 |
5.75 |
5.75 |
5.75 |
- |
- |
|
Dadra
& Nagar Haveli |
15.67 |
67.11 |
50.84 |
17.57 |
13.52 |
17.14 |
- |
- |
|
|
26.22 |
12.41 |
14.69 |
0.40 |
9.42 |
8.23 |
- |
0.7 |
|
|
42.36 |
34.95 |
25.04 |
9.38 |
20.27 |
15.60 |
- |
- |
|
|
50.06 |
41.46 |
37.40 |
20.55 |
22.11 |
21.67 |
- |
- |
|
Source:
Planning Commission
(2002): National Human
Development Report, 2001, March. |
|
|||||||
However,
wide variations have been noticed in the poverty ratios of different
states. The ratio for Orissa at 47.15 per cent is about eight times that
for
Employment
The changes in the pattern of employment structure have a significant impact on varying degrees of income inequality. Since the governments function within the administrative and fiscal constraints, the target group programmes normally have a marginal impact on income redistribution. Other economic instruments such as target group policies and programmes have a short-term impact, but the income redistribution through employment is generally viewed as more sustainable.
Current Employment and Unemployment Scenario
It is essential to focus on broad employment situation as it exists today, which indicates the extent and direction of income inequalities across all sections of the society. Some such aspects are listed below:
- 7.32 per cent of the labour force in 1999-2000 was unemployed. In absolute terms the number of unemployed stood at 26.58 million.
- Since the above estimates are on Current Daily Status basis, the number of unemployed also includes the number of those who are underemployed in terms of underutilization of the labour time. But it excludes such underemployed who are working at very low levels of income and productivity.
- Among the employed, the proportion of poor is as high as in the population at large, suggesting a large proportion of workers engaged in subsistence employment.
- Only about 8 per cent of the total employment is in organised sector leaving more than 90 per cent engaged in informal sector activities, which is, largely outside the reach of any social security benefits.
- The educational and skill profile of the large proportion of the existing workforce is very poor.
Current
State of
Labour
Force Skills
It
is not easy to quantify the level of skills in the labour force because
these data sets are not readily available. What is available is
information on the education attained by the labour force. About 44 per
cent of all workers in 1999-2000 were illiterate and another 22.7 per
cent had schooling only up to the primary level. If we define the
minimum level of education necessary to function in a modern economy as
schooling up to the middle level, then only about 33.2 per cent of the
labour force had schooling of that level and above. The percentage was
higher at 57.4 per cent for the urban labour force, but it was
correspondingly worse in rural areas, with only 25.4 per cent for the
rural labour force meeting these standards. This, undoubtedly,
provides enough support for a high incidence of rural-urban income
disparities based on positive education–income correlation. It is
largely evident that education levels in the labour force in
Moreover,
the levels of vocational skills in the Indian labour force compares
poorly with the position in other countries. Only 5 per cent of the
Indian labour force in the age group of 20-24 is trained in vocational
skills whereas the same in industrial countries is much higher, varying
between 60-80 per cent. In the long term, a strategy to impart
vocational skills will facilitate increase in income of labour through
changes in their occupational profile at a rapid pace. This is because
the traditional avenues for work in agriculture are poised to alter
substantially, as ability of this sector to absorb the work force has
diminished at a fast pace over the last two decades. Therefore, a
greater emphasis on vocational training in relation to general education
is required.
Income
Inequalities arising out of Structural Adjustments in Employment Pattern
|
Table
4 : Growth in Employment during 1993-94 and 1999-2000 |
||
|
Sector |
Per
cent change per annum in employment growth (1999-2000/1993-97) |
|
|
|
|
|
|
|
UPSS
# |
CDS* |
|
Agriculture |
-0.34 |
-0.12 |
|
Mining
and Quarrying |
-2.85 |
-2.55 |
|
|
|
|
|
Manufacturing |
2.05 |
2.66 |
|
Electricity,
gas and water supply |
-0.88 |
-3.43 |
|
Construction |
7.09 |
5.22 |
|
|
|
|
|
Trade,
hotels and restaurants |
5.04 |
5.85 |
|
Transport
storage and communication |
6.04 |
5.61 |
|
Finance,
insurance, real estate and business services |
6.2 |
5.62 |
|
Community,
social and personal services |
0.55 |
-2.0 |
|
|
|
|
|
All-India
Work force |
0.98 |
1.07 |
|
All-India
Labour force |
1.07 |
1.31 |
|
Unemployment
rate (per cent) 1999-00 |
2.2 |
7.32 |
|
Notes:
# Usual Principal Subsidiary Status based on old population Census
and Technical Group *Usual
Daily status based on 2001 Population Census Source:
Planning Commission (2002): Report of Special Group on
Targeting Ten million Employment Opportunities a Year in Tenth
Plan |
||
Agricultural Wages
Though, the share of agriculture in the total employment as reflected by an absolute fall in agricultural employment during 1993-94 to 1999-00 (Table 4) has been declining over the years, the pace of this deceleration has been slower than the pace of shrinking share of agriculture in the GDP. As a result, a clear divergence has emerged between the shares of primary, secondary and tertiary sectors in employment and output, suggesting thereby large inter-sectoral differences in the per worker incomes. In this context, trends in agricultural wages prove to be an important indicator reflecting increasing preference of the labour force to shift towards non-agricultural activities. According to ‘Agricultural Wages in India’, published by the Directorate of Economics and Statistics, Ministry of Agriculture, the real agricultural wages grew at 5 per cent per annum in 1980s and 2.5 per cent per year in the 1990s. Interestingly, with the introduction of the Fifth Pay Commission by the central as well as the state governments, salaries in the public sector during the 1990s have grown at almost 5 per cent per year. Given that salaries of public sector employees tend to be much better of than agricultural labourers, this can be taken as an instance of rising economic disparities between different occupation groups. Since agricultural labourers and public sector employees typically reside in rural and urban areas, respectively, this finding may just be another side of the coin of rising rural-urban disparities. Moreover, for the medium and high skill-based workers, with the emergence of newer industries like BPOs and call centres catering to foreign clients, especially in the fields of information technology (IT), Information Technology Enabled Services (ITES), banking and finance, the income levels in these areas have risen disproportionately in a short span leaving large sections of the society with marginal or negligible wage increases over the last decade, thereby contributing to increasing income inequalities.
After
reviewing the broad indicators of emerging income inequalities, it might
be argued that a short-term increase in income inequality is to be
expected in a liberalising economy. However, China’s experience (Table
2) of sharp and sustained increase in economic inequality over a period
of more than 20 years, after market-oriented reforms were initiated in
the late 1970s, does not inspire much confidence in this prognosis. It
is in fact, an important pointer to the possibility of a further
accentuation of economic disparities in
IV
Instances of Increasing Income Disparities
Slum
Population
Interestingly, although poverty levels have come down in most of the states from 1993-94 to 1999-00, the poor population has been increasingly shifted towards urban areas in search of jobs resulting in ever-increasing slum population in urban areas in most of the states (Table 5). One of the glaring facts underlined by the rising proportion of slum population to urban population (from 21 per cent in 1991 to 28 per cent in 2001 at all India level) essentially shows increasing concentration of poor in urban areas and underlines the glaring fact of either underdevelopment or a very slow pace of growth in other backward regions. As expected, this phenomenon has been more prominent through 1990s in most states.
|
Table 5: State-wise Urban Slums
in |
|||||||||||||
|
States |
Urabn
Population (lakh) |
Percent
Change |
Slum
Population |
Percent
Change |
Slum
Population as per cent |
||||||||
|
|
|
|
|
|
|
|
|
|
|
|
of
Urban Population |
|
|
|
|
2001 |
1991 |
1981 |
2001/1991 |
1991/1981 |
2001 |
1991 |
1981 |
2001/1991 |
1991/1981 |
2001 |
1991 |
1981 |
|
Andhra Pradesh |
249.7 |
178.9 |
124.9 |
39.6 |
43.2 |
60.2 |
43.1 |
28.6 |
39.5 |
50.9 |
24.1 |
24.1 |
22.9 |
|
Arunachal Pradesh |
1.9 |
1.1 |
0.4 |
69.9 |
167.1 |
0.4 |
0.2 |
0.0 |
69.7 |
- |
20.0 |
20.0 |
0.0 |
|
|
32.4 |
24.9 |
17.8 |
30.1 |
39.6 |
5.8 |
4.5 |
1.2 |
30.0 |
262.7 |
18.0 |
18.0 |
7.0 |
|
|
149.6 |
113.5 |
87.2 |
31.7 |
30.2 |
35.4 |
26.9 |
32.7 |
31.7 |
-17.7 |
23.7 |
23.7 |
37.5 |
|
Chattisgarh |
na |
na |
na |
na |
na |
na |
na |
na |
na |
na |
na |
na |
na |
|
|
6.6 |
4.8 |
3.5 |
36.7 |
36.4 |
1.1 |
0.8 |
0.2 |
37.0 |
244.2 |
17.4 |
17.4 |
6.9 |
|
|
190.0 |
142.5 |
106.0 |
33.4 |
34.4 |
34.4 |
25.8 |
15.3 |
33.2 |
68.5 |
18.1 |
18.1 |
14.4 |
|
Haryana |
59.6 |
40.6 |
28.3 |
46.9 |
43.4 |
10.1 |
6.8 |
2.7 |
47.1 |
149.6 |
16.9 |
16.9 |
9.7 |
|
Himachal Pradesh |
5.8 |
4.5 |
3.3 |
28.3 |
37.8 |
1.6 |
1.3 |
0.8 |
28.7 |
64.8 |
28.0 |
27.9 |
23.3 |
|
|
24.2 |
18.4 |
12.6 |
31.4 |
45.9 |
7.8 |
5.9 |
6.3 |
31.4 |
-5.6 |
32.2 |
32.2 |
49.7 |
|
Jharkhand |
na |
na |
na |
na |
na |
na |
na |
na |
na |
na |
na |
na |
na |
|
Karnataka |
191.0 |
139.1 |
107.3 |
37.3 |
29.6 |
17.8 |
12.9 |
5.8 |
37.3 |
125.1 |
9.3 |
9.3 |
5.4 |
|
Kerala |
103.5 |
76.8 |
47.7 |
34.7 |
61.0 |
16.5 |
12.2 |
4.1 |
34.7 |
197.9 |
15.9 |
15.9 |
8.6 |
|
Madhya Pradesh |
204.1 |
153.4 |
105.9 |
33.0 |
44.9 |
28.0 |
21.0 |
10.8 |
32.9 |
95.6 |
13.7 |
13.7 |
10.2 |
|
|
416.2 |
305.4 |
219.9 |
36.3 |
38.9 |
107.4 |
78.7 |
43.2 |
36.4 |
82.4 |
25.8 |
25.8 |
19.6 |
|
Manipur |
6.7 |
5.1 |
3.8 |
32.6 |
34.6 |
1.1 |
0.9 |
0.2 |
32.7 |
417.0 |
16.9 |
16.9 |
4.5 |
|
Meghalaya |
4.6 |
3.3 |
2.4 |
39.6 |
36.8 |
1.2 |
0.8 |
0.7 |
39.8 |
26.2 |
25.2 |
25.2 |
27.4 |
|
Mizoram |
6.4 |
3.2 |
1.2 |
102.1 |
161.0 |
1.2 |
0.6 |
0.0 |
102.1 |
- |
18.1 |
17.9 |
0.0 |
|
Nagaland |
3.1 |
2.1 |
1.2 |
46.4 |
73.2 |
0.6 |
0.4 |
0.0 |
46.4 |
- |
20.0 |
20.0 |
0.0 |
|
Orissa |
56.3 |
42.4 |
31.1 |
33.0 |
36.2 |
11.2 |
8.4 |
2.8 |
32.9 |
199.0 |
19.9 |
19.9 |
9.1 |
|
|
80.2 |
59.9 |
46.5 |
33.9 |
28.9 |
18.9 |
14.1 |
11.7 |
33.9 |
21.2 |
23.6 |
23.6 |
25.1 |
|
Rajasthan |
137.2 |
100.7 |
72.1 |
36.3 |
39.6 |
32.7 |
24.0 |
10.3 |
36.0 |
134.1 |
23.8 |
23.8 |
14.2 |
|
|
0.5 |
0.4 |
0.5 |
29.7 |
-27.6 |
0.1 |
0.1 |
0.0 |
29.5 |
295.8 |
25.7 |
25.7 |
4.7 |
|
Tamil Nadu |
233.1 |
190.8 |
159.5 |
22.2 |
19.6 |
43.6 |
35.7 |
26.8 |
22.0 |
33.5 |
18.7 |
18.7 |
16.8 |
|
Tripura |
5.1 |
4.2 |
2.3 |
20.4 |
86.9 |
0.9 |
0.7 |
0.2 |
20.0 |
304.3 |
17.6 |
17.6 |
8.2 |
|
Uttar Pradesh |
365.4 |
276.1 |
198.9 |
32.4 |
38.8 |
77.1 |
58.4 |
25.8 |
32.0 |
126.3 |
21.1 |
21.2 |
13.0 |
|
Uttranchal |
na |
na |
na |
na |
na |
na |
na |
na |
na |
na |
na |
na |
na |
|
|
236.6 |
187.1 |
144.5 |
26.5 |
29.5 |
65.8 |
52.0 |
30.3 |
26.6 |
71.6 |
27.8 |
27.8 |
21.0 |
|
All States |
2769.4 |
2078.8 |
1528.8 |
33.2 |
36.0 |
580.7 |
436.5 |
260.2 |
33.0 |
67.7 |
21.0 |
21.0 |
17.0 |
|
UTS |
140.1 |
92.3 |
65.8 |
51.8 |
40.2 |
37.6 |
26.2 |
18.9 |
43.8 |
38.0 |
26.8 |
28.3 |
28.8 |
|
|
122.9 |
84.7 |
57.7 |
45.1 |
46.9 |
32.6 |
22.5 |
18.0 |
44.9 |
24.9 |
26.5 |
26.5 |
31.2 |
|
|
2209.4 |
2176.1 |
1594.6 |
33.7 |
36.5 |
618.3 |
462.7 |
279.1 |
33.6 |
65.8 |
28.0 |
21.3 |
17.5 |
|
na:
Not available or not relevant Source:
NSUS : National Slum Upgradation Scheme |
|||||||||||||
Inter-state
Differences
The overall disparity in inter-state growth of net state domestic product (NSDP) and per capita NSDP of states has increased considerably during the nineties as compared to the eighties and the seventies. (Table 6). In recent times, the decade of 1980s seems to be a period in which horizontal inequity across states was lower than that compared with the 1990s where the magnitude of disparities has been maximum.
|
Table
6:Disparity in Growth amongst States/Union Territories |
||||
|
Period |
Measure
of disparity in
Growth
Standard
deviation |
Relative
measure of disparity in growth between per capita income and
NSDP (Covariance) |
||
|
NSDP |
Per
capita NSDP |
|||
|
1970-71
to 1979-80 |
2.22 |
1.81 1.02 2.4 |
3.67 |
|
|
1980-81
to 1990-91 |
1.71 |
0.71 |
||
|
1993-94
to 1998-99 |
3.13 |
5.23 |
||
|
Note:
The higher the value, the more the disparity. |
||||
|
Source:
Central Statistical Organsiation |
||||
A comparison of the trends in rates of economic growth for all the states in the 1990s shows that less developed regions including the north eastern states, Orissa and the heartland states of Bihar, Uttar Pradesh and Madhya Pradesh have generally recorded growth rates below the all- India average during the most recent period of 1993-94 to 1998-1999. This trend suggests a widening of the gap between the more and the less developed states.
Income
Tax
The data on income tax paid, number of returns filed and income of those who have filed the returns (Appendix A) show that there has been a shift in the levels of income with increasing higher levels of income. There has been a significant shift in the income levels during the period 1990-91 to 1999-00. In the slab 50,001-1,00,000, the number of returns filed which stood at 17 per cent of the total returns filed in 1990-91 increased to 37 per cent and 63 per cent in 1993-94 and 1990-00, respectively. Similarly, income from returns as a per cent of total income at 28 per cent in 1990-91 has risen to 44 per cent in 1999-2000 for this income slab. Those earning over 10 lakhs annually as a per cent of total number of returns have increased from 0.04 per cent in 1990-91 to 0.55 per cent in 1999-2000. But more importantly, their share in total tax paid has increased from 6 per cent to 24 per cent during the same period. This indicates the rising share of income of those earning above 10 lakhs while those earning between Rs 50,000 to Rs 1,00,000 has reduced from 34 per cent in 1990-91 to 13 per cent in 1999-00.
Summing
up
Despite an optimistic macro-economic scene (as reflected in Table 1) and reducing poverty (as depicted in Table 3), there is a fundamental inquiry raised as to what extent the overall economic growth has been meaningful to masses or broad sections of the society. Clearly, there are indications of increasing income disparities in the country. There is no full proof redistrbutive mechanism or instant solution to tackle this problem. However, in the long run, we need some strategy to narrow down widening income gaps across the wide spectrum of the society so as to attain a permissible level of income disparities, which, in fact, could be conducive to growth. For the present, there is a need for the government to play more active role in providing social security safety net as well as for the private sector to assume a greater responsibility given their pivotal role being played in the economy.
Annexure
A
In the article titled ‘Poverty and Inequality in India –II, Widening Disparities during the 1990s’ Abhijit Sen and Himanshu, have depicted sharp increases in income inequalities in the 1990s in all respects and have concluded that poverty reduction has deteriorated markedly despite higher growth during the reference period. The chart below shows some very clear trends in terms of which sections of the population have benefited and which have lost out during the years of economic reforms.
The
most dramatic and remarkable improvement in consumption has been for
those who were already the richest people in
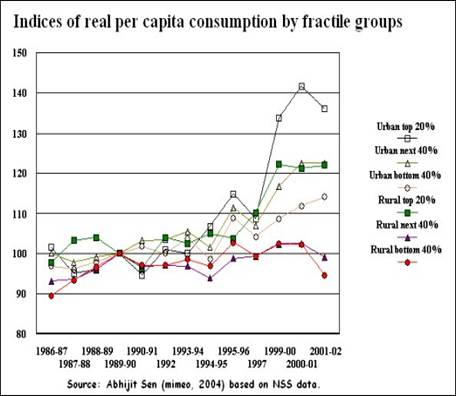
This is the
highest and most rapid increase in the consumption of the rich that has
ever been recorded in
By
contrast, the bottom 40 per cent of the urban population relatively
little increase in per capita consumption compared to these other
groups, at only around 14 per cent since 1989-90. But the most
dramatic evidence is for the bottom 80 per cent of the rural
population – well more than half of
References:
Planning Commission, Tenth Five-Year Plan Documents (2002-07), Volume III
UNDP, Human Development Report, various issues
Deaton,
Angus and Jean Dreze (2002): ‘Poverty and Inequality in
Sen
Abhijit and Himanshu (2004): ‘Poverty and Inequality in
Widening Disparities during the 1990s’, Economic and Political Weekly, September
---------------------------------------------------------------------------------------------------
*This note is prepared by Ms Piyusha Hukeri and Ms Gauri Ranade.
![]()
Highlights of Current Economic Scene
AGRICULTURE
The central government has announced a further increase of Rs 40 per quintal, in addition to the previously announced Rs 10 per quintal rise, in the minimum support price (MSP) of paddy for the ensuing 2006-07 kharif marketing season. With the latest modification, the MSP has been raised to Rs 620 for common paddy and Rs 650 per quintal for ‘Grade A’ varieties from Rs 580 per quintal and Rs 610 per quintal, respectively.
The central government has re-imposed various controls, including stock holding limits on wheat and pulses trade, to keep the prices of these two commodities under control. The restriction would be applicable for 6 months, with no limitations on inter-state movements or imports.
The Minerals and Metals Trading Corporation (MMTC) Ltd., a state-owned trading company, has cancelled a tender to buy1.2 lakh tonnes of wheat due to high tender price. The corporation had floated the tender on August 8, 2006, in response to which, Germany-based AC Toefer had offered to supply about 1.25 lakh tonnes wheat at a price ranging from $219-227 per tonne, on cost and freight (C&F) basis.
The
performance audit of foodgrain management by the Comptroller and Auditor
General (CAG) of India has revealed significant inefficiencies in grain
procurement that have cost the country about Rs 1,310.3 crore between
2000-01 and 2004-05. The report has indicated diversion of over 4.4
million tonnes of foodgrains meant for the targeted public distribution
system (TPDS) in 10 states, including
The
central government has allowed import of an additional 20-lakh tonnes of
wheat at zero custom duty as a part of measures to meet the shortfall in
procurement for Public Distribution System (PDS). State –run food
corporation of
As per the Central Silk Board, silk export earnings of the country have exceeded the target (Rs 2,800 crore) set for the fiscal year 2005-06, on account of higher demand for readymade silk garments in the global market. Export earnings have surged by 9.7 per cent to Rs 3158.2 crore from Rs 2,879.6 crore during last fiscal year. The US, UK, Italy, German Republic and Spain have emerged as the top 5 countries importing Indian silk goods, accounting for 58.1 per cent of the total export earnings.
Southern
Shrimp Alliance (SSA), an organisation of shrimp farmers based in the
The government of Andhra Pradesh has plans to undertake the cultivation of bio-diesel plants like Pongamia and Jatropa on at least 1 lakh acre of land in each in 13 districts under the National Rural Employment Guarantee Programme (NREGP). Apart from providing financial support to the tune of Rs 3,500 per acre, to farmers interested in bio-diesel plantation, the government would also create marketing facilities for bio-diesel produced under the scheme.
The government of Karnataka and Agriculture and Processed Food Products Export Development Authority (APEDA) has plans to set up an agri export zone (AEZ) for Vanilla, entailing an investment of Rs 2.56 crore. APEDA would assist the state government in supplying quality planting material, plant protection and post harvest handling, training on vanilla cultivation, micro irrigation, processing units, in setting up quality control labs and imparting organic farming techniques. Six districts, namely, Dakshina Kannada, Uttara Kannada, Udupi, Shimoga, Kodagu and Chickamagalur have been selected for the AEZ.
Infrastructure
Power
Independent power producers (IPPs) like Sterlite, Essar Power, Tata Power Company, etc, with investments planned in various states, have sought the power ministry’s intervention for an early decision on long term coal linkages for their upcoming projects arguing that a delayed decision would stall the financial closure and in turn delay the project development.
The synchronisation of the country's largest and most power-deficit grid – the northern grid – with the eastern, north-eastern and western grids will be achieved from September. The attempt to synchronise operations in four of the country's five regional grids was prompted by a need to ramp up the interconnection between the northern and eastern grids for transferring up to 1,000 MW surplus power from the eastern region to the energy-deficit northern region. With the prospect of the four regions operating together in synchronisation, apprehensions of any potential grid indiscipline endangering the grid security in all the four regions have prompted the grid managers to stipulate measures such as a blanket ban on bypassing of under frequency relays (UFRs) in the regions.
The non-availability of gas is forcing producers to run power projects below capacity while investors are being forced to shelve upcoming projects. For example, the petroleum ministry has recently turned down Reliance Energy Ltd’s (REL) plea for conversion of 0.36 metric million standard cubic meters per day (mmscmd) fall back allocation of natural gas as firm allocation for its Samalkot Combined Cycle Power Station in Andhra Pradesh stating shortage of gas supply in the region and no possibility for any new allocation of natural gas or converting the fall back allocation into firm allocation at present. Similarly, the non-availability of gas has forced West Bengal Power Development Corporation Ltd (WBPDCL) to shelve gas-fired component of 2,000 mw combined cycle power project power project and the corporation has failed to tie up the required gas supply for the project.
Petroleum,
Petroleum Products and Natural Gas
The country's crude oil production has risen by 4.1 per cent in July 2006 to 2.87 million tonnes (mt) from 2.75 mt during the corresponding month last year. The country's natural gas output has risen by 2.4 per cent to 2.76 billion cubic meters (bcm) in the month under review from 2.69 bcm during the same period last year.
Non-Conventional
Energy
The Andhra Pradesh government has announced plans to take up cultivation of bio-diesel plants in 13 districts under the National Rural Employment Guarantee Programme (NREGP). The chief minister has also expressed interest in providing financial support to the tune of Rs 3,500 per acre to farmers interested in bio-diesel plantation. The state government has proposed to venture into the plantation of pongamia and jatropa on at least 1 lakh acre of land in each of the 13 districts under the NREGP programme during 2006 and to further create marketing facilities for bio-diesel produced under the scheme.
A 3.5 MW capacity power project using poultry droppings as fuel will go on stream in Tamil Nadu's Tiruchengodu taluk on August 26, 2006. The project has been developed under the demonstration category of power projects under the ministry of non-conventional energy Sources (MNES) and is being promoted by the Tiruchengodu-based Subhashri Bio Energies Pvt Ltd at a cost of Rs 40 crore. It has been granted Rs 6 crore from the MNES and a term loan of Rs 14 crore from Indian Overseas Bank. Besides the promoters' contribution of Rs 6 crore, the project has also been given working capital to the tune of Rs 14 crore. Originally planned as a 2-MW power project, the generation capacity has been enhanced to 3.5 MW; the plant is fed with 325 tonnes of poultry litters every day to generate power. It is also equipped to produce 150 tonnes of manure as a by-product daily from the slurry generated out of the plants digestors after generating power. The location has been chosen considering the density of poultry farms in the vicinity as the contiguous Namakkal poultry tract with three crore birds generating over 1,500 tonnes of poultry litters every day. Subhashri Bio Energies has already entered into a power purchase agreement with the Tamil Nadu Electricity Board which would be buying the energy generated from the plant at Rs 3.15 per unit.
Steel
The
steel ambitions of the three iron ore rich states of Orissa, Jharkhand and
Chhattisgarh have moved far beyond the 100 million tonnes annual steel
making capacity by 2019-20 envisaged in the National Steel Policy approved
by the government in November 2005. In fact, going by the list of probable
steel producing units lined up by these three states,
Coal
The
reform process in the domestic coal mining sector is set to gain further
momentum with a series of new coal projects being planned to be developed
by Coal India Ltd (CIL) by outsourcing nearly all mine preparation and
coal extraction jobs to leading international and domestic companies in
the coming months. CIL has been allowed to start developing at least nine
large coal projects as early as possible so that it can achieve the
targeted production by 2011-12. In fact, these are part of a total 13
large projects, each costing more than Rs 100 crore, which have been
approved by the union coal ministry, while 10 more large projects are
expected to get approval shortly. In almost all the projects, jobs such as
overburden removal and coal extraction will be outsourced from private
operators, except in two where either the overburden removal or coal
extraction only will be done privately. Meanwhile, the Central Mine
Planning & Design Institute has prepared a total of 97 detailed
project reports for CIL, which may be developed in the Tenth and Eleventh
Plan periods. Of the total projects, some 23 large ones each with an
investment of over Rs 100 crore have been placed before the ministry for
approval. A total of 25 projects with an investment of less than Rs 100
crore were placed before the CIL board and the balance 49 projects each
with an investment of about Rs 50 crore were to be approved by the
respective subsidiary of CIL. The board has approved 19 projects while the
subsidiaries have cleared a total of 41 projects so far.
Roads
The
ministry of road transport and highways has circulated cabinet notes
regarding projects in the NHDP phases V (8 projects) and VI (1 project).
The phase V envisages six-laning of existing four lane highways; work on
one section, Vadodara to
Railways
The Indian railways has set goals for obtaining a larger share of the freight traffic; a part of its objectives for the 11th Plan is to target particular commodities such as cement, iron and steel and containerised traffic and resultantly triple its share in transporting them. In 2005, the railways carried 55 mt of cement, which it plans to increase to 200 mt by 2010 by tapping not only finished cement but also related raw materials like clinker, fly ash, coal, limestone, dolomite and gypsum. The railways also has plans to increase its freight carrying in iron and steel to 200 mt as against the 83 mt in 2005 as well as increase its freight in the containerised traffic segment from the current 18 mt to 100 mt by 2010. As part of these efforts, the railway ministry is planning to sign long-term service agreements with players in these sectors; the agreements would be for a period of 5-10 years and entail fines in case of delays by either party. Under the 11th Plan, the railways will also embark on a new wave of expansion of infrastructure, which would include construction of unloading terminals, warehouses, covered sheds and specialised wagons. The ministry has also decided not to ask for any funds under the 11th Plan wanting to carry out all these projects through internally generated funds and private investments or possibly third party logistics.
Inflation
The annual point-to-point inflation rate based on wholesale price index (WPI) has gone up to 4.92 per cent for the week ended August 12, 2006 from 4.82 per cent during the previous week. The inflation rate was at 3.67 per cent in the corresponding week last year.
The WPI in the week under review has gone up by 0.2 per cent to 204.7 from the previous weeks’ level of 204.3 (Base: 1993-94=100). The index of ‘primary articles’ group (weight 22.02 per cent) has increased by 0.5 per cent to 203.6 from its previous week’s level of 202.5, mainly due to an increase of 0.5 per cent in the price index of both, the ‘food articles’ and ‘non-food articles’. The index of ‘food articles’ has gone up to 204.8 from 203.7 in the previous week, mainly due to the higher prices of fruits and vegetables and condiments and spices. Similarly, the index of ‘non-food articles’ has increased to 184.7 from 183.8, mainly due to the higher prices of raw rubber, raw cotton, niger seed and groundnut seed. The index of ‘fuel, power, light and lubricants’ group (weight 14.23 per cent) has remained unchanged at its previous week’s level of 328.4. The index of ‘manufactured products’ group constituting the maximum of 63.7 per cent of total weight, has risen a tad by 0.1 to 177.4 from the previous weeks’ level of 177.2, mainly due to the higher prices of textiles, base metals,’ ‘non-metallic mineral products’ and ‘transport equipment and parts’.
The latest final index of WPI for the week ended June 17, 2006 has been revised upwards; as a result both, the absolute index and the implied inflation rate stood at 203.5 and 5.50 per cent as against their provisional levels of 203.4 and 5.44 per cent, respectively.
Public
Finance
The tax revenue of VAT (Value Added Tax) implementing states has seen an increase of 27.1 per cent for the first quarter of the fiscal year 2006-07 over the corresponding period of the previous year. The tax revenue of theses states has displayed a growth of 13.8 per cent for the year 2005-06 over the previous year. This growth has been higher than the compound annual growth rate of sales tax revenues of these states for last five years.
The Empowered Committee of state finance ministers on VAT and Finance Ministry have finalised a compensation package for phasing out the Central Sales Tax (CST). States also have informed the Central government that they would be willing to consider 40 per cent share of the overall service tax proceed instead of 50 per cent demanded earlier, as an interim compensation measure. They have also abandoned their demand to include sugar, tobacco and textiles under VAT and have instead suggested continuing with the present norm of the Centre allocating one per cent from its revenue collection to the states towards these three items. The states have projected an 18 per cent CST growth and have accordingly pointed out that the losses on account of reduction in CST from 4 to 3 per cent from October 1, 2006 would be Rs 2,500 crore this fiscal and Rs 12,000 crore next fiscal.
The Finance Ministry has set a target of indirect tax arrears recovery at Rs 2,450 crore for 2006-07. Of this target, the Central Board of Excise and Customs (CBEC) has been expected to recover Rs 650 crore as customs duty, Rs 1,300 crore as central excise duty and Rs 500 crore as service tax arrears. As on February 28, 2006, the pending recovery of total indirect tax arrears has stood at Rs 21,578 crore. Out of this amount, Rs 7,533 crore has been stayed by various courts and hence was not recoverable.
Direct
tax collection from the Mumbai zone has recorded a huge increase of 137.5
per cent to Rs 11,400 crore during the period April 1, 2006 to July 15,
2006 as compared to Rs 4,800 crore for the corresponding period of the
previous year. This healthy growth reflects strong performance of industry
sectors such as banking, automobile, pharmaceuticals and insurance. The
target collection from the Mumbai zone for the entire financial year
2006-07 is Rs 69,000 crore.
The
finance ministry has been preparing a paper on the rationalisation of
non-merit subsidies as part of a larger expenditure management plan. It
has been expected to finish the preparation within three months. The next
budget may refurbish the subsidy structure.
The
Delhi Bench of the Income-Tax Appellate Tribunal has reached on a verdict
that there would be no tax liability for downlinking services of satellite
companies based in countries that have a Double Taxation Avoidance
Agreement (DTAA) with
Banking
In
a move to speed up financial inclusion in the north-east (NE) region, the
RBI has recommended the commercial banks to prepare a roadmap so that the
branches in this region can give banking access to 50 new households every
month for the next four years with a deposit account, with option to the
household of opening such account as a “no frills” account. A
committee of the central bank which was chaired by deputy governor Usha
Thorat has held extensive discussions with different stakeholders in all
the seven states of the region and said that the focus should be on
proactively connecting banks to the people, rather than waiting for
walk-in-customers. Taking into account the balances maintained in such
accounts over a period, the bank may offer small overdrafts or general
credit credit cards against such accounts and other products. The apex
bank has also recommended setting-up of a dedicated SME Debt Fund by SIDBI,
in association with major banks, to provide-finance upto 25 per cent of
project cost to first time entrepreneurs investing in agro-processing,
agro-based industries and SME sector, where a bank is willing to provide
the required funds. It has also suggested enhancement of insurance cover
under Credit Guarantee Fund Trust for Small Scale Industries (CGTSI)
scheme to cover up to 90 per cent in the NE region, as against the risk
cover of 75 per cent subject to a maximum of Rs 25 lakh available in the
rest of the country.
The
Bangalore-based Syndicate Bank has revised its benchmark primary lending
rate (BPLR) from 11.25 per cent to 11.50 per cent with effect from August
23, 2006.
Financial Markets
Capital
Markets
Primary Market
Action
Construction Equipment Ltd is to tap the market between September 1 and 7
through issue of shares of Rs 10 each in a price band of Rs 110 and Rs 130
per equity share.
Secondary
Market
The stock market has remained bullish with the BSE sensex registering a gain of 107 points to close the week at 11572.20 as the international crude oil prices eased. Moreover, the banks extended their recovery on expectations that interest rates may not rise in the near term. The state bank of India (SBI) has received an additional boost after the Union Cabinet paved the way for a follow-on public issue by approving the SBI (Amendment) Bill. The bill proposes to lower the floor for RBI’s holding in SBI to 51 per cent from 59.73 per cent held currently. Meanwhile, the bank’s board has ratified the bank’s decision early this month to raise prime lending rate by 25 basis points.
Among
the sectoral indices of BSE, barring capital goods, FMCG and health care
indices, all the others have registered positive gains with the highest
gain being recorded by metal index of about 4 per cent. While BSE sensex
recorded a rise of 0.9 per cent so did the BSE mid-cap, the BSE small cap
recorded a surge of 1.10 per cent.
During
the week under review, FIIs have remained net buyers of equities to the
extent of Rs 568 crore with purchases of Rs 5939 crore and sales of Rs
5372 crore, while mutual funds have turned net sellers to the extent of Rs
56 crore with sales of Rs 2628 crore and purchases of Rs 2572 crore.
As
per Financial Express research bureau, the
National
Securities Depositories Ltd (NSDL) has said that if a depository
participant (DP) opens a account without adequate proof of residence or
identity or without conforming to the NDSL rules then a penalty of Rs
5,000 would be charged and if two such deviations were observed then the
amount of penalty would increase.
Derivatives
The
daily average turnover of futures and options segment of NSE has increased
from Rs 19,537 crore in the week ended August 18 to Rs 22,533 crore in the
week under review.
Government
Securities Market
Primary
Market
RBI
conducted auction of state development loans with 10-year maturity for
four states for an aggregate amount of Rs 1050 crore at a cut-off of 8.11
per cent.
The
cut-off yield set at the 91-day Treasury bill has remained steady at 6.40
per cent in the auction held on August 23, while that of 182-day TB has
risen to 6.72 per cent from 6.69 per cent set in the previous week.
Secondary
Market
RBI
has authorised three more banks, Hongkong and Shanghai Banking Corportaion
Ltd, Bank of America and J P Morgan Chase Bank to undertake primary
dealership with effect from August 28, 2006; concomitantly, the
authorization given to HSBC primary dealership (India) Private Limited,
Bank of America Securities (India) Pvt Ltd and J P Morgan Securities India
Private Ltd as primary dealers stands withdrawn.
Despite
the rising inflation rate, the weighted average YTM of 7.59 per cent 2016
has fallen from 8.03 per cent on August 18 to 7.94 per cent on August 25
as the international oil prices have eased.
Bond
Market
During
the week, two banks, one financial institution and a central government
undertaking have tapped the market to mobilise Rs 1,400 crore.
Foreign
Exchange Market
RBI
has permitted scheduled commercial banks (SCBs) to offer internet based
foreign exchange services in addition to the local products already
allowed to be offered on internet based platforms subject to terms and
conditions.
During
the week, the rupee has depreciated from Rs 46.48 on August 18 to Rs 46.61
on August 25, while the six-month forward premia has declined to 1.31 per
cent on August 25 from 1.43 per cent on August 18.
Commodities
Futures derivatives
Forward
Market Commission (FMC) has circulated a draft guidelines among exchanges
seeking their views to facilitate the launch of portfolio management
services (PMS) in commodities. Indication are that PMS would be on the
same lines as that in equities with such services being offered to high
net worth individuals.
Insurance
Bharati
AXA Life Insurance Company Ltd has started its operations with the opening
of its first branch office in
Corporate Sector
According to Reserve Bank of India (RBI) data, overseas borrowings by Indian companies have increased by 91 per cent to $ 4.43 billion in the first quarter of the current (Q1) fiscal year from $ 2.23 billion a year ago. As per RBI, during Q1 2006-07, corporates have mobilised $ 2.22 billion through external commercial borrowings (ECBs), up 28 per cent from Q1 2005-06 and $ 2.21 billion through foreign currency convertible bonds (FCCBs), up 273 per cent. The data shows that the companies have planned to use FCCB and ECB loans for various purposes like modernisation of existing facilities, new projects and import of capital goods.
|
Table:
Top ECB/FCCB borrowers in Q1 2006-07 ($ million) |
|||
|
Borrower |
ECB |
Borrower |
FCCB |
|
MMD
Health Care |
300 |
Amtek
Auto |
250 |
|
Indian
Farmers and Fertilisers |
246 |
Reliance
Natural Resources |
250 |
|
Kingfisher
Airlines |
126 |
Jubilant
Organosys |
200 |
|
Essar
Steel |
120 |
Mah
and Mah |
200 |
|
Bharti
Airtel |
102 |
Aurobindo
pharma |
150 |
|
Source:
RBI (www.rbi.org.in) |
|||
Engineering
and construction company Punj Lloyd has secured an order worth over Rs
1,347 crore ($ 290 million) from
Construction company Patel Engineering Limited has received an order of Rs 318 crore from National Thermal Power Corporation (NTPC) for a 600-MW hydro power project in Uttaranchal.
KEC
International Limited has received three orders worth Rs 150 crore from
international and domestic markets. GRTE, the power transmission division
of Algerian company Sonelgaz, has placed Rs 70 crore order for supply and
construction of 400 kv single circuit transmission line over 52 km from
Ain Sefra to Mougrar. The West Bengal State Electricity board has placed
Rs 58 crore order for construction of three lines of 132 kv each around
Haldia. The company has also received Rs 22 crore contract in
Bharat Forge and the Maharashtra government has signed a memorandum of understanding to set up a multi-product special economic zone (SEZ), spread over 2,000 hectares at Khed in Pune with an initial investment of Rs 2,000 crore. The state government will hold 24 per cent equity through its industrial infrastructure arm, Maharashtra Industrial Development Corporation (MIDC). The SEZ is likely to attract the investment of around Rs 25,000 crore and create around 1.20 lakh jobs in the region.
Tata Tea Limited and its promoter Tata Sons have jointly acquired 30 per cent shares in Energy Brands Incorporate a US based company, for around Rs 3148 crore ($ 677 million).
Punj
Lloyd has formed a joint venture with Kaefer Insulation of Germany to set
up a large cold chain network across
Pulp and paper manufacturer Ballarpur Industries Limited (BILT) has registered an increase of 67.7 per cent in net profit to Rs 67.9 crore for the quarter ended June 2006. The company’ sales revenue has risen by 8.7 per cent to Rs 571.35 crore from Rs 525.35 crore in the corresponding period a year ago. The sales revenues have been helped by growth in sales of paper and paper product, which grown by 15.8 per cent to Rs 477.5 crore. For the year ended June 2006, BILT has reported a growth of 26.2 per cent in its net profit to Rs 212 crore from Rs 168 crore.
Telecom
In
one of the biggest network management and rollout deals globally,
![]()
|
Macroeconomic Indicators |
|
Table
1 : Index Numbers of Industrial Production (1993-94 =100) |
|
Table
2 : Production in Infrastructure Industries (Physical Output Series) |
| Table 3: Procurment, Offtake and Stock of foodgrains |
|
Table
4: Index Numbers of Wholesale Prices (1993-94 = 100) |
|
Table
5 : Cost of Living Indices |
|
Table
6 : Budgetary Position of Government of India |
|
Table
7 : Government Borrowing Programmes and Performance |
|
Table
8 : Scheduled Commercial Banks -
Business |
|
Table
9 : Money Stock : components and Sources |
|
Table 10 : Reserve Money : Components and Sources |
|
Table
11 : Average Daily Turnover in Call Money Market |
|
Table
12 : Assistance Sanctioned and Disbursed by All-India Financial
Institutions |
|
Table
13 : Capital Market |
|
Table
14 : Foreign Trade |
|
Table 15 : India's Overall Balance of Payments |
|
Table
16 : Foreign Investment Inflows |
| Table 17 : Foreign Collaboration Approvals (Route-Wise) |
| Table 18 : Year-Wise (Route-Wise) Actual Inflows of Foreign Direct Investment (FDI/NRI) |
|
Table
19 : NRI Deposits - Outstandings |
|
Table
20 : Foreign Exchange Reserves |
|
Table 21 : Indices REER and NEER of the Indian Rupee |
|
Table
22 : Turnover in Foreign Exchange Market |
| Table 23 : India's Template on International Reserves and Foreign Currency Liquidity [As reported under the IMFs special data dissemination standards (SDDS) |
| Table 24 : Settlement Volume and Netting Factor for Government Securities Transactions Settled at CCIL - Monthly, Quarterly and Annual Basis. |
| Table 25 : Inter-Catasegory Distribution of All Types of Trade in Government Securities Settled at CCIL (With Market Share in Respective Trade Types) |
| Table 26 : Category-wise Market Share in Settlement Volume of Government Securities Transactions (in Per Cent) |
| Table 27 : Settlement Volume and Netting Factor for Total Forex Transactions Settled at CCIL - Monthly, Quarterly and Annual Basis. |
| Table 28 : Inter-Category Distribution of Total Foreign Exchange Transactions Settled at CCIL (With Market Share in Respective Trade Types) |
![]()
|
Memorandum Items |
*These statistics and the accompanying review are a product arising from the work undertaken under the joint ICICI research centre.org-EPWRF Data Base Project.
We will be grateful if you could kindly send us your feed back at epwrf@vsnl.com