Current Economic Statistics and Review For the
Week
Ended May 06, 2006
Theme
of the week:
Prevalence of Child Labour: Issues and Concerns*
Child Labour: A Social Evil and A Sign of Underdevelopment
The
incidence of child labour1
is widely known across various nations of
the world and its far-fetching consequences have been discussed at length
from time to time. The
origin of child work can be traced back to the early stages of the
evolution of societies, in which the process of learning by working (child
work) was considered as part and parcel of the social and economic uplift;
it was also probably a part of the survival
process. In the transition period, attitudes towards children
changed and their labour was seen as a marketable service. Similarly,
their nature of work, working conditions, environment and employment
relations also changed over a period with an attitude of gaining greater
economic benefits from a child’s work rather than his/her growth and
development. In other words, child labour is detrimental to a child’s
growth as it not only interferes with his/her education, but also inhibits
physical, mental, spiritual, moral and social development. Hence, there is
a general consensus that child labour is reprehensible and unacceptable in
any civilized society.
The
roots of high incidence of child labour lie at the number of
socio-economic factors; the most important being poverty. The other
factors are demand and supply for labour, lack of access to relevant and
quality education and societal attitude. Children
in poor families work to ensure the survival of their family and
themselves. Though they are generally underpaid, they still serve as major
contributors to family income in developing countries. School attendance
by a child is highly correlated with family income (Ilon and Moock
1991). Therefore, when a child drops out of school, it is not
necessarily because of irresponsible parenting; but could be due to the
family's economic conditions. Similarly, parental education plays a large
role in determining child schooling and employment (Tienda 1979). Also,
lack of access to schools (due to distance or no school at all) also
forces children to work. As a result, parents weigh home-learning (for
e.g. working in agricultural fields) and supplementing family income much
more than the formal education. Thus, the causes of child labour are
varied, but whatever the reason may be, making a child work at the cost of
his social, educational and mental development has its far-reaching
detrimental implications, not only on the child, but also on the community
at large in the long-run. What is more, it deprives a child from his
childhood and his dignity as against the opportunities that normal
individuals in the society avail. No doubt that in the case of poor
families, it is better to work than to die. However, such instant economic
gains are too inferior to be compared with the long run benefits that the
child, the family and the entire society could receive by preventing a
child from working at a premature age.
Key-statistics
According
to United Nations International Children’s Educational Fund (UNICEF),
an
estimated 246 million children are engaged in child labour all over the
world. Of these, almost 70 per cent (171 million) work in hazardous
occupations, such as working in mines, chemical factories, in agricultural
fields (approximately 70 per cent) with constant contact with pesticides
or with dangerous machinery. Moreover, millions of girls work as domestic
helpers and also unpaid household help and are especially vulnerable to
exploitation and abuse. Millions of others work under horrific
circumstances; they may be trafficked (1.2 million), forced into debt
bondage or other forms of slavery (5.7 million), into prostitution and
pornography (1.8 million), into participating in armed conflict (0.3
million) or other illicit activities (0.6 million).
According
to UNICEF (Child Labour Today, 2005), regional estimates indicate
that:
-
The Asian and Pacific regions harbour the largest number of child workers in the 5 to 14 age group, 127.3 million in total. (19 per cent of the children work in the region.)
-
Sub-Saharan
-
Latin America and the
-
13.4 million children work in the Middle East and
-
Approximately 2.5 million and 2.4 million children are working in industrialised and transition economies, respectively.
The
end-decade (2000) multiple indicator cluster surveys (MICS) by UNICEF,
for the first time enabled 49 developing countries to report on working
children. Children were counted as working if, during the week before the
survey, they were engaged in paid or unpaid work for someone who is not a
member of the household, did housekeeping jobs for 4 or more hours per
day, or worked for a family farm or business. A preliminary analysis shows
that in more than 30 countries covering 35 per cent of the developing
world population, 19 per cent of 5 to 14 year-olds are working. Apart from
the fact that such a large child population has been working, there exist
disparities across these countries in terms of gender and rural-urban
distribution as shown in the charts below.
Chart
1
Chart 2
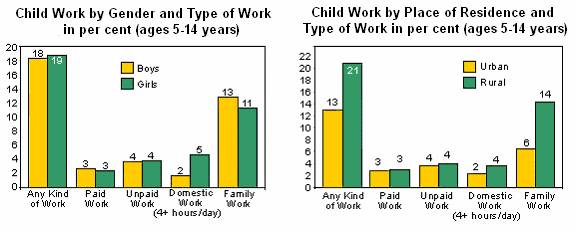 It is clear from the chart that there
is no significant difference between boys (18 per cent) and girls (19 per
cent) in the proportion of working, except for the more number of girls
are engaged in domestic jobs. However, as shown in chart 2, there is a
substantial urban-rural differences, with 21 per cent of children aged
5-14 working in rural areas as compared to only 13 per cent in urban
areas. Clearly, the prevalence of the children engaged in family work
(farm or family business) as well as the domestic work is more in rural
areas. Interestingly, the same
proportion, that is 3 per cent and 4 per cent of children are engaged in
paid and unpaid jobs, respectively, in both the urban and rural areas.
It is clear from the chart that there
is no significant difference between boys (18 per cent) and girls (19 per
cent) in the proportion of working, except for the more number of girls
are engaged in domestic jobs. However, as shown in chart 2, there is a
substantial urban-rural differences, with 21 per cent of children aged
5-14 working in rural areas as compared to only 13 per cent in urban
areas. Clearly, the prevalence of the children engaged in family work
(farm or family business) as well as the domestic work is more in rural
areas. Interestingly, the same
proportion, that is 3 per cent and 4 per cent of children are engaged in
paid and unpaid jobs, respectively, in both the urban and rural areas.
The
cross-country comparison (chart 3) shows that Sub-Saharan African
countries like
Chart
3

Interestingly, even in the developed world, the incidence of child
labour is visible. For e.g. in
II
Child
Labour: A Case for
In
A
Fact file on Child Labour in
India
As
per the Census of India, there were 10.75 million child labourers in the
age group 5 to 14 years in 1971, 13.64 million in 1981, 11.28 million in
1991 and 12.7 million (3.6 per cent of workforce based on current daily
status) in 2001. In absolute terms, there is no consistent trend in the
number of working children at the national level, though there is some
decline in the incidence of child labour. This can be said given the fact
that the period 1971-1991 has recorded the highest decadal population
growth (24.7 per cent in 1981 and 23.8 per cent in 1991) in independent
|
Table
1:Economically Active Children (aged 10 to 14 years) in
|
|
|
Year |
Economically
active children as per cent of age group |
|
1990 |
16.7 |
|
1995 |
14.4 |
|
1999 |
12.5 |
|
2000 |
12.1 |
|
2001 |
11.6 |
|
2002 |
11.2 |
|
2003 |
10.7 |
|
1999-2003
(average) |
11.6 |
|
Source:
World bank, World Development Indicators, 2005 |
|
compared to that experienced in 1981.
Furthermore, the fact of declining incidence of child labour is also supported by the findings of the World Bank that the economically active children (aged 10 to 14 years) have been on decline since 1990. As shown in the Table 1, the number of working children as per cent of total number of children in the same age group has declined from 16.7 per cent in 1990 to 10.7 per cent in 2003 (For more details, see Appendix Table A).
According to the report published by UNICEF titled ‘The State of the World’s Children 2006’, about 14 per cent of the children (5 to 14 years) of the total children in the age group were engaged in child labour activities in 2004, with the percentages for boys and girls almost same at 14 per cent and 15 per cent, respectively.2
Regional
Pattern
There
is a considerable disparity in the number of child workers across various
states and union territories of
|
Table
2: Trends in State-wise Distribution of Working Children in the
Age Group 5-14 Years (in numbers) Based
on Various Census Results in |
|||||||
|
Name
of the State/UT |
2001# |
|
1991 |
|
1981 |
|
1971 |
|
Andhra
Pradesh |
1363339 |
-18.0 |
1661940 |
-14.8 |
1951312 |
19.9 |
1627492 |
|
|
351416 |
7.3 |
327598 |
- |
** |
- |
*239349 |
|
|
1117500 |
18.6 |
942245 |
-14.5 |
1101764 |
4.0 |
1059359 |
|
|
485530 |
-7.3 |
523585 |
-15.1 |
616913 |
19.1 |
518061 |
|
Haryana |
253491 |
131.1 |
109691 |
-43.5 |
194189 |
40.9 |
137826 |
|
Himachal
Pradesh |
107774 |
91.0 |
56438 |
-43.3 |
99624 |
39.6 |
71384 |
|
|
175630 |
- |
** |
- |
258437 |
266.6 |
70489 |
|
Karnataka |
822615 |
-15.7 |
976247 |
-13.7 |
1131530 |
39.9 |
808719 |
|
Kerala |
26156 |
-24.8 |
34800 |
-62.5 |
92854 |
-16.9 |
111801 |
|
Madhya
Pradesh |
1065259 |
-21.2 |
1352563 |
-20.4 |
1698597 |
52.7 |
1112319 |
|
|
764075 |
-28.5 |
1068427 |
-31.4 |
1557756 |
57.6 |
988357 |
|
Chhattisgarh |
364572 |
- |
- |
- |
- |
- |
- |
|
Manipur |
28836 |
74.8 |
16493 |
-18.4 |
20217 |
23.4 |
16380 |
|
Meghalaya |
53940 |
55.7 |
34633 |
-22.9 |
44916 |
47.6 |
30440 |
|
Jharkhand |
407200 |
- |
- |
- |
- |
- |
- |
|
Uttaranchal |
70183 |
- |
- |
- |
- |
- |
- |
|
Nagaland |
45874 |
178.6 |
16467 |
1.4 |
16235 |
18.3 |
13726 |
|
Orissa |
377594 |
-16.5 |
452394 |
-35.6 |
702293 |
42.6 |
492477 |
|
|
177268 |
24.1 |
142868 |
-34.1 |
216939 |
-6.8 |
232774 |
|
Rajasthan
|
1262570 |
63.1 |
774199 |
-5.5 |
819605 |
39.5 |
587389 |
|
|
16457 |
194.0 |
5598 |
-34.6 |
8561 |
-45.3 |
15661 |
|
Tamil
Nadu |
418801 |
-27.7 |
578889 |
-40.6 |
975055 |
36.7 |
713305 |
|
Tripura |
21756 |
32.0 |
16478 |
-31.9 |
24204 |
38.4 |
17490 |
|
Uttar
Pradesh |
1927997 |
36.7 |
1410086 |
-1.7 |
1434675 |
8.1 |
1326726 |
|
|
857087 |
20.4 |
711691 |
17.6 |
605263 |
18.3 |
511443 |
|
Andaman
& Nocobar islands |
1960 |
54.9 |
1265 |
-3.4 |
1309 |
128.8 |
572 |
|
Arunachal
Pradesh |
18482 |
49.1 |
12395 |
-30.9 |
17950 |
0.1 |
17925 |
|
|
3779 |
102.1 |
1870 |
-5.8 |
1986 |
82.9 |
1086 |
|
Dadra
& Nagar Haveli |
4274 |
-3.2 |
4416 |
22.2 |
3615 |
16.5 |
3102 |
|
|
41899 |
53.2 |
27351 |
6.4 |
25717 |
50.2 |
17120 |
|
Daman
and |
729 |
-22.5 |
941 |
-90.0 |
9378 |
26.9 |
7391 |
|
|
4138 |
-11.1 |
4656 |
- |
- |
- |
- |
|
|
27 |
-20.6 |
34 |
-39.3 |
56 |
-42.3 |
97 |
|
Mizoram
|
26265 |
60.0 |
16411 |
159.9 |
6314 |
- |
* |
|
|
1904 |
-29.0 |
2680 |
-25.7 |
3606 |
-3.2 |
3725 |
|
Total |
12666377 |
12.2 |
11285349 |
-17.3 |
13640870 |
26.8 |
10753985 |
|
Note:
# Includes marginal workers * 1971 Census figures of **
Census could not be conducted
- not applicable Figures
in italics represent percent variation over the previous decade. Source:
Ministry of Labour and Employment
(www.labour.nic.in) |
|||||||
Interestingly,
during 1990s, a
more than half (57 per cent) of the child labour in ![]()
Correlates
of Child Labour in
Although
there are little studies establishing correlation between the incidence of
child labour and alternative socio-economic variables, some of them have
been quite useful to draw inferences. A study by Sachdeva, Malhotra &
Murthy (2001), has tried to establish such correlation and their results
are based on data for 1991. According to the study, the incidence of child
labour is negatively correlated to parental literacy levels (correlation
coefficient of -0.85). This means that higher the parental education
level, lower are the chances of child labour. Similarly, the study also
revealed that there was a negative correlation between child labour and
net state domestic product (-0.56); and child labour and average
consumption (-0.58). Contrary to this, as expected, there was a high
positive correlation (0.80) between human poverty index and an incidence
of child labour, which underlines the fact that high levels of poverty is
closely associated with higher incidence of child labour.
Apart
from poverty, high incidence of child labour can be attributed to high
costs of schooling and disinterest in education (The International
Institute for Population Sciences (IIPS), National Family Health Survey,
1998-99). Also, for girls, an engagement in the household work has
posed as another major reason for not attending school. Not surprisingly,
the need for children to work in the household is more for girls than for
boys, and the need for children to work on the family farm, in the family
business or outside the home for payment is more frequently mentioned for
boys than for girls.
Another
attribute of child labour associates with reasonably extended labour
opportunities and a segmentation of the labour market. Under conditions of
an excess labour supply and thus low demand for labour, one actually would
expect employers to employ adults rather than children by lowering adult
wages to a level hardly above the level of child wages. However, this is
not always true. Under such circumstances, unhindered by countervailing
power, employers have created selective markets for child labour in
addition to a labour market for adults. Child labour actually correlates
with high levels of employment [see Lieten 2002]. In the case of
high labour demand, child labour appears to be higher. In high demand
areas, female and male work participation is also high. Thus, broadly, the
incidence of child labour can be observed under both the conditions; a low
or high demand for labour, but it is generally higher in the case of
latter.
III
Provisions
and Efforts to Eliminate Child Labour since
The Constitution of India has addressed the issue of child labour explicitly (Articles 24, 39 and 45) to incorporate specific provisions, to secure compulsory education and labour protection for children. Article 24 of the Indian constitution clearly states "No child below the age of fourteen years shall be employed to work in any factory or mine or employed in any hazardous employment" (Constitution of India cited in Jain 1985). Article 39 (e) directs State policy such "that the health and strength of workers . . . and the tender age of children are not abused and that citizens are not forced by economic necessity to enter avocations unsuited to their age or strength" (Constitution of India cited in Human Rights Watch 1996).
Further,
the government of
(1) Transport of passengers, goods or mails by railways;
(2) Cinder picking, clearing of an ash pit or building operation in the railway premises;
(3) Work in a catering establishment at a railway station, involving the movement of a vendor or any other employee of the establishment from the one platform to another or in to or out of a moving train;
(4) Work relating to the construction of a railway station or with any other work which is done in close proximity to or between the railway lines;
(5) A port authority within the limits of any port;
(6) Work relating to selling of crackers and fireworks in shops with temporary licenses;
(7) Abattoirs/Slaughter House;
(8) Automobile workshops and garages;
(9) Foundries;
(10) Handling of toxic or inflammable substances or explosives;
(11) Handloom and power loom industry;
(12) Mines (underground and under water) and collieries;
(13) Plastic units and fibre glass workshops;
The
industries which are highly exploitative in India are match factories,
lock and brassware industry, diamond cutting, gem polishing, carpet
weaving and beedi making (Press Information Bureau, 2003).3
The greatest hazard in these workshops is exposure to glue and other
solvents that cause respiratory ailments, nausea, lethargy, and sometimes
irreversible damage to the functioning of the immune system.
Apart
from permanent damage to physical health, they neither gain in terms of
reasonable wages nor through the work experience in future. This is shown
in a major study undertaken for ILO in
"Contrary
to accepted belief, persons who start work at an early age do not, in
adulthood, have any advantage in terms of higher productivity or wages
over workers who join employment at a later age. In fact, in some cases it
is quite the reverse. In the lime industry, for instance, even where the
productivity is the same, the wages earned by those workers who had joined
work as adults is higher than those who had joined as children. In the
carpet industry workers who had joined as children have both lower
productivity and lower wages in adulthood. The advantage of "future
gain" thus clearly does not exist for the worker who enters
employment as a child".
National
Child Labour Project (NCLP), 1988
Ahead
of the ‘Child Labour Act’, the government introduced NCLP in 1988. The
scheme aimed at the rehabilitation of children after they stop working.
Under the scheme, project societies at the district level were fully
funded for opening up of special school/rehabilitation centres for child
workers. These centres needed
to provide non-formal education, vocational training, supplementary
nutrition, stipend etc. to children withdrawn from employment. Till
Ninth Five-Year plan (1997-2001), hundred projects (districts) were
sanctioned for covering about 2.11 lakh children in 13 states. Under
the scheme, more than four thousand schools had been sanctioned in these
projects during the Ninth Plan. So far, more than four lakh working
children have been covered under the scheme and about 3.08 lakh children
have been mainstreamed into formal education system.
Furthermore,
an advance in government policy occurred in August 1994, when the Prime
Minister announced his proposal of ‘Elimination of Child Labour
Programme’. This programme pledged to end child labour for two million
children in hazardous industries as defined in the Child Labour Act of
1986, by 2000. The programme announced an incentive for children to quit
their work and enter non-formal schooling by providing rupees hundred
payment as well as one meal a day for attending school (Human Rights
Watch 1996).
With
the revision of NCLP in 2003, the scheme has been expanded to additional
150 districts in the Tenth Plan (2002-07), thereby covering a total of 250
districts in the country under the NCLP Scheme. The main objectives of the
scheme in the Tenth Plan are child labour elimination efforts, which would
be linked to the Sarva Shiksha Abhiyan (SSA) of the Department of
Elementary Education and Literacy, Ministry of Human Resource Development
(HRD). The intention has been to ensure that all children in the age group
of 5-8 years get directly linked to the formal school education system. It
was also felt that a more focused and effective enforcement of the
provisions of the Child Labour (Prevention & Regulation) Act, 1986
needed to be put in place in the districts during the Tenth Plan period.
Unfortunately,
enforcement of these laws is the key aspect that has been lacking in the
government’s efforts. No enforcement data for child labour laws are
available. Although the lack of data does not necessarily mean enforcement
is non-existent, the high number of child labourers and their work
participation rates show that enforcement, if existent, is ineffective (World
Bank, Working Paper). Recognising these limitations, the government
has introduced some additional efforts to combat child labour in the
recent past. The various efforts are:
INDO-USDOL
(
The Ministry of Labour and US Dept. of Labour have developed a project
under ILO-IPEC (International Programme on the Elimination of Child Labour)
for prevention & elimination of child labour in identified hazardous
sectors. The Indus Project is jointly funded by the Ministry of Labour,
Government of India and the Department of Labour, United States of America
(USDOL) and is being implemented in ten hazardous sectors in 21
districts across five states namely,
Budgetary Allocation to Eliminate Child Labour
The
Central allocation for elimination of child labour increased almost
three-fold during the Tenth Plan; it increased to Rs. 602 crore from Rs.
250 crore during the Ninth Plan. Apart from the bilateral financial
assistance from the ILO and UNICEF, the cost (US $400 million) of the
Indo-US joint programme for elimination of child labour, has been shared
equally by
IV
Issues
and Concerns
Despite
constitutional provisions and the Acts, the problem of child labour has
persistently remained for many decades. Given the magnitude of child
labour (more than 12 million) across regional and gender dimension, there
cannot be a uniform policy framework for all states. A major factor behind
the limitation of the regulatory regime in ![]()
Apart
from what is desirable, clearly, the target of complete elimination of
child labour is too ambitious to achieve for the government or any
non-governmental body, at least in near future. Therefore, in addressing
the issue of child labour, the policy framework, public interventions and
civil society initiative has to necessarily focus on to bring about a
decline in the proportion of time spent by children in providing labour.
At the same time, the time spent by an average child on education has to
increase. Therefore, the immediate action plan with a pragmatic approach
should include:
First,
the child labour should be completely removed from all hazardous
occupations as mentioned above. This will ensure safety as well as
financial support to them at least in the short term. Second, the
enforcement of the compulsory elementary education is the need of an hour
in order to address the issue of ‘no where children’. The
Constitution (86th Amendment) Act 2002, enacted in December 2002 seeks to
make free and compulsory education a fundamental right for all children in
the age-group 6-14 years. Positively, it is compatible with a certain
amount of part-time work, and therefore a good way to prevent full-time
work for children. Third, due to a strong correlation between the
incidence of child labour and the parental education, it is indispensable
to improve adult literacy rate (defined as a proportion of literate
population in the age group 15 years and above), which is a meagre 57 per
cent as per NSSO 54th round (Jan-June 1998). No doubt that the
literacy rate of India has increased from 18.33 per cent in 1951 to 65.4
per cent in 2001, despite the fact that during these last five decades
there has been exponential growth of the population to nearly 8 per cent
per annum. However, this literacy rate should improve further consistent
with the goal of the ‘National Literacy Mission’ (1988) by the
Department of Elementary Education and Literacy is to attain full literacy
i.e. a sustainable threshold level of 75 percent by 2005. The mission
seeks to achieve this by imparting functional literacy to non-literates in
the 15-35 age group. Literacy to this age group would directly enable them
to be a part of workforce as well as it would reduce the inevitability for
children in the family to be economically active.
Given the current scenario, there is an urgent need to
implement some such measures in order to gradually combat the problem of
child labour. This will ensure timely education and assist in resolving
number of structural bottlenecks like high population growth, unemployment
and general poor living conditions. Most importantly, it would ensure
child’s healthy development, which would ultimately reflect overall
socio-economic progress of the community at large.
---------------------------------------------------------------------------------------------------
End
Notes
1 There
are wide conventional differences on ‘child labour’ as described by
various national and international organisations. For e.g. UNICEF, ILO
considers a child as one in the age group of 5 to 14, whereas, the World
Bank and UNDP define a child as one in the age group of 10 to
14 years.
2 Kindly note that due to definitional differences of various organisations with respect to child labour, the data are not strictly comparable. However, they give some idea of the long term-trends. Moreover, as the child labour is employed only in unorganised sector, data are based on different surveys, which further reduce the comparability among them.
3 The exact number of children working in such industries is difficult to gauge due to non-availability of data.
*
This note is prepared by Gauri Ranade
![]()
Highlights of Current Economic Scene
AGRICULTURE
The
first consignment of five lakh tonnes of wheat, imported from
The
decision by the central government to provide a bonus of Rs 500 per tonne
above the minimum support price (MSP) to wheat growers, who have sold
their produce to government, was too late to gear up the wheat procurement
in marketing season 2006-07. The wheat procurement during marketing season
2006-07 is likely to be lower by 3 to 4 million tonnes from 14.8 million
tonnes procured during 2005-06, mainly because of market prices being
higher than the MSP (Rs 650 per quintal) in major wheat producing states.
Wheat procurement by the government has been sluggish at 8.5 million
tonnes as on April 25, 2006, a fall of 32 per cent over the previous year.
Given
the lower wheat procurement in addition to anticipated marginal fall in
wheat production and depleting wheat stocks in the country, the government
had decided to import another 3 million tonnes of wheat in 2006-07. It is
planning to allow actual users like private flourmills and other users to
import the grain under the open general licence scheme at concessional
duties to ensure that the supplies do not flow to traders
Wheat
movement from the wheat-producing states of north to southern region has
bee halted, following the suspension of the open market sale scheme (OMSS)
by the Food Corporation of India (FCI) and so-called shortage of railway
wagons for transport. FCI has stopped offering wheat to private traders
under OMSS from the beginning of April 2006 owing to record low stocks of
the wheat in the central pool during the season and under the pressure to
supply 1.5 million tonnes of wheat every month under the public
distribution schemes across the country. The railway has stopped allotting
rakes to the traders to transport wheat from Haryana and
As
per the statistics available with the Rubber Board, 69,446 tonnes of
natural rubber has been exported from the country under different grades
during financial year 2005-06. On the other hand its import has been less
than 50,000 tonnes during the same period. With the estimated total
opening stock of 1,06,200 tonnes as on April 01, 2006, the total
availability (opening stock in addition to imports) of natural rubber in
the domestic market would be around 9,53,872 tonnes. While the production
of natural rubber has stood at 8,03,230 tonnes, the consumption has been
8,01,385 tonnes during 2005-06 was. With an increase of 3.5 per cent in
production and 5 per cent improvement in consumption over the pervious
year, the consumption is expected to exceed the production.
The
National Agricultural Cooperative Marketing Federation of India (Nafed)
has procured 1,600 tonne of onions at Rs 300 per quintal in
The
latest data from DGCI&S has revealed that the trade surplus from
external trade in agricultural commodities has augmented by around 61 per
cent to Rs 9,412 crore during April – December 2005-06 over the period
of one year. The exports has reported a surge of 13 per cent to stand at
Rs 22,723 crore, while the imports has declined by 6 per cent to Rs 13,509
crore during the same period. the exports has risen due to higher
production of many commodities including rice, pulses, fruits, vegetables
and coffee, with processed fruits and juices reporting the highest export
growth of 62 per cent followed by coffee, non-basmati rice and guargaum
meal recording more than 50
per cent growth in their exports.
Indian
Meteorological Department (IMD) has predicted the rainfall during monsoon
season 2006 (June-September, 2006) to be 93 per cent of the long period
average of 89 cm with an error margin of plus or minus of 5 per cent.
According to new model adopted by IMD for forecasting of rainfall since
2002, this rainfall is categorized as ‘below normal’. Following this
new model, the probability of rainfall being deficient is only 22 per
cent. However the forecast is futile in the absence of details of special
distribution of rainfall and timing of the rains.
INDUSTRY
Automobiles
Auto
component exports from
Pharmaceuticals
Medicines
sold in retail in the country will shift to a uniform system of maximum
retail price (MRP) inclusive of local taxes from June 1. Currently, MRP is
exclusive of local taxes and the MRP is printed on medicine packs with the
suffix ‘local taxes extra’. The move has been necessitated due to
consumer disputes arising out of the present price fixing mechanism. While
the maximum selling prices are fixed, the actual selling prices vary from
state to state due to the local taxes.
Metals
As
per a new import policy in
INFRASTRUCTURE
Overall
The
six infrastructure industries have grown by 4.9 per cent during the
financial year 2005-06 as compared to 5.8 per cent in the previous year,
largely due to negative growth in crude petroleum and slump in petroleum
products and finished steel for most part of the year. Cement has been a
major performing sector growing by 12.3 per cent during 2005-06 compared
to an increase of 6.6 per cent in 2004-05.
|
Growth
Performance of the Six Core Industries
Growth
Rate (per cent) |
||||
|
Industry
(Percent Weight in IIP) |
March
|
April-March |
||
|
2006 |
2005 |
2005-06 |
2004-05 |
|
|
Crude
petroleum (4.17) |
-2.4 |
1.1 |
-5.3 |
1.8 |
|
Petroleum
products (2.00) |
9.4 |
-2.2 |
2.1 |
4.3 |
|
Coal
(3.22) |
7.4 |
8.8 |
6.4 |
6.4 |
|
Electricity
generation (10.17) |
3.1 |
3.3 |
5.1 |
5.2 |
|
Cement
(1.99) |
17.0 |
6.3 |
12.3 |
6.6 |
|
Finished
steel (5.13) |
17.5 |
17.0 |
6.5 |
8.4 |
|
Overall
(26.68) |
8.8 |
6.9 |
4.9 |
5.8 |
|
Source:
www.eaindustry.nic.in |
||||
Petroleum
and Petroleum Products
In
a report the Petroleum Planning and Analysis Cell (PPAC), the petroleum
ministry’s technical wing, has estimated that under-recoveries of oil
companies will touch a record high of Rs 57,000 crore during 2006-07, if
domestic product prices are not revised and global crude oil prices hover
around the current level of over $74 a barrel and could worsen if prices
move up further. During 2005-06 this figure has stood at Rs 39,600 crore.
In April alone, under-recoveries of oil companies will peak to Rs 4,722
crore - under-realisations on diesel will be the highest at Rs 1,941 crore,
followed by kerosene at Rs 1,366 crore, LPG at Rs 1,084 crore and petrol
at Rs 331 crore. At the existing global crude prices, petrol is under
priced by Rs 5.66 a litre, diesel by Rs 7.64 a litre, kerosene by Rs 14.29
a litre and LPG by Rs 195.10 a cylinder.
GAIL
India, which holds 28.33 per cent equity in the Ratnagiri Gas & Power
Pvt Ltd (RGPPL), has expressed its inability to complete the
re-gasification plant with a total LNG storage capacity of 5 million
tonnes per annum (mmtpa) by December this year as it has been yet unable
to place orders for the same and has projected the plant to be ready by
April 2007. Till then RGPPL will have to run the plant on the more
expensive naphtha with the per unit tariff ranging between Rs 4.25 and Rs
7.50. The naphtha is priced at around $19 million per British thermal unit
(BTU) in the global market. RGPPL has proposed to restart block II of 740
MW using nearly 42,000 kilolitres of naphtha, which is stored at the plant
site and run the plant for eight hours. It also has plans to source
additional 30,000 kilolitres of naphtha to continue its operations. It has
already entered into a bilateral agreement up to June with Maharashtra
State Electricity Distribution Company (MahaDiscom) for the sale of power
at the per unit tariff of Rs 4.25.
Non-Conventional
Energy
Under
a demonstration project for cultivation of non-edible oil-bearing plants
and trees for production of bio-diesel, the rural development ministry has
released an amount of Rs 4,900 crore to nine states identified under the
project, namely, Chhattisgarh, Gujarat, Andhra Pradesh, Himachal Pradesh,
Tamil Nadu, Rajasthan, Sikkim, Tripura and Assam. This allocation has been
made for plantation of Jatropha curcas in 200,000 hectare forest land and
200,000 hectare non-forest wasteland over a period of five years; and also
to be used for technology development, technical support to growers
through training, capacity building and other facilitating arrangements.
Additionally, the assistance includes development of 80,000 hectare
Jatropha nurseries for providing quality seedlings in 2006-07. Petroleum
companies under the instructions from the union ministry of petroleum and
natural gas have decided to purchase Jatropha oil at Rs 25 per litre,
which translates to seed price of Rs 5 per kg on certain assumptions of
yield realization from by-products. There are about 552,692.26 sq kms of
wastelands in the country, out of which 62.87 per cent, amounting to
347,490.15 sq km, are suitable for cultivation of Jatropha. Though these
are non-edible oil-bearing trees, the National Mission on Bio-diesel has
suggested special focus on cultivation of Jatropha curcas on wastelands.
Coal
Coal
India Limited (CIL) has increased its production by 6.19 per cent to 343
million tonnes of coal in 2005-06, compared to 323 million tonnes in
2004-05. Neyveli Lignite Corporation has produced 215.67 lakh tonnes of
coal in 2005-06.![]()
INFLATION
The
annual point-to-point inflation rate based on wholesale price index (WPI)
has gone up to 3.55 per cent for the week ended April 15, 2006 from 3.24
per cent during the previous week. The inflation rate was at 5.91 per cent
in the corresponding week last year.
The
WPI in the week under review has increased by 0.5 per cent to 198.5 from
197.6 in the previous week (Base: 1993-94=100). The index of primary
articles’ group (weight 22.02 per cent) has declined by 0.4 per cent to
194.3 from the previous week’s level of 195.1, mainly due to a
considerable decline by 0.6 per cent and 4 per cent in the price index of
food articles and minerals, respectively.
The index of ‘food articles’ has gone down to 196.7 from 197.9
in the previous week, mainly due to a fall in the prices of poultry
chicken, wheat and barley, fruits and vegetables and bajra. Similarly, the
index of ‘Minerals’ has declined to 342.7 from 357.1 in the previous
week, mainly due to a decline in the prices of steatite, iron ore,
magnesite and kaolin. The index of ‘fuel, power, light and lubricants’
group (weight 14.23 per cent) has gone up marginally to 316.8 from
previous weeks’ level of 316.7, mainly due to higher pries of aviation
turbine fuel. The index of ‘manufactured products’ group constituting
the maximum of 63.7 per cent of total weight, has also gone up
considerably by 0.9 per cent to 173.5 from the previous week’s level of
171.9. The major groups, which contributed to this increase, were the food
products, textiles, ‘chemical and chemical products’, ‘non-metallic
mineral products’, base metals and machinery tools.
The
latest final index of WPI for the week ended February 18, 2006 has been
revised downwards; as a result both, the absolute index and the implied
inflation rate stood at 196.7 and 4.13 per cent as against their
provisional levels of 197.1 and 4.34 per cent, respectively.
BANKING
Bank
of India’s net profit in the fourth quarter of 2005-06 have augmented by
382 per cent to Rs 254.42 crore from Rs 52.79 crore a year earlier. The
bank’s net profit for the year ended March 31, 2006 has more than
doubled to Rs 701.44 crore from Rs 361.39 crore.
Bank
of Baroda’s (BoB) net profit in the fourth quarter ended March 2006
increased by around 107 per cent to Rs 208.80 crore from Rs 101.04 crore a
year earlier, primarily on account of a sharp rise in non-interest income
(NII). During the fourth quarter the NII income rose by 46 per cent to Rs
401.12 crore in the from Rs 275 crore a year earlier.
The Reserve Bank of India (RBI) has asked all banks to seek from companies either an affidavit or an undertaking certifying the end use of working capital during the disbursements of funds. The banking regulator is concerned that a part of the working capital loans availed by companies may have been finding its way to stock and real estate markets. The directive aims at checking the flow of funds into speculative activities. Besides, the RBI also wants to rein in the phenomenal credit growth currently witnessed by the banking sector. The non-food credit has been over 30 per cent in the last two years (2004-05 and 2005-06), leading to over a 100 per cent credit-deposit ratio in the banking system. The RBI, in its annual credit policy, has projected 20 per cent credit growth for 2006-07. The RBI has noted an upsurge in the working capital loans. Companies are citing interest rate uncertainties as the reason for availing large working capital loans to keep costs down in the event of interest rates rising further. Banks have been lending to the corporate sector both in domestic rupee and foreign currency.
PUBLIC
FINANCE
The
15 services which are specifically mentioned in the category of taxable
services and the amendments made relating to existing taxable services
shall come into effect from the May
1, 2006. In other words, these changes relating to taxable services will
be effective from 1.5.2006.
Section
65 defines taxable services and various terms used in relation to taxable
services. Section 66 is the
charging section and provides for levy of service tax on taxable services.
These two sections have been amended in the Finance Act, 2006 and these
amendments shall come into effect from 1.5.2006.
For details refer to notification No.15/2006-Service Tax dated 25th
April, 2006.
Fifteen services which are specifically mentioned in the category
of taxable services are:
Service
provided by a registrar to an issue;
Service
provided by a share transfer agent
Automated
teller machine operations, maintenance or management
Service
provided by a recovery agent
Sponsorship
services provided to any body corporate or firm, other than services in
relation to sponsorship of sports events
Transport
of passengers embarking on international journey by air, other than in
economy class
Transport
of goods in containers by rail provided by any person other than
Government railway
Business
support services
Auctioneers’
service, other than in relation to auction of property under directions or
orders of a court of law or auction by the Government
Public
relations service
Ship
management service
Internet
telephony service
Transport
of persons by cruise ship
Credit
card, debit card, charge card or other payment card related services
FINANCIAL
MARKET
Capital
Markets
Primary
Market
D.S.Kulkarni
Developers Limited will be tapping the primary with its public offer of 55
lakh equity shares at a price band of Rs 250 to Rs 275 per equity share.
The issues will open on April 25 and closes on May 3.
Secondary
Market
During
the week, the market has been witnessing volatility on account of various
reasons like the rise in the international crude oil prices to $70 per
barrel, weakness in the Asian markets, Sebi’s interim order on the IPO
scam, NSE’s hike in margins in both the cash and derivative segments and
profit booking by the FIIs. The BSE sensex hit a low of 11344 points on
April 28 before recovering to 12043 points in the special session on April
29, thus registering a nominal week-on-week gain of 0.1 per cent.
Meanwhile, nifty has also correspondingly dropped to lows of 3342 points
before recovering to 3557.6 points for a small week-on-week loss of 0.43
per cent. Amongst the sectoral indices all the major indices have closed
the week in positive territory except BSE IT, which has registered a
decline of 3.56 per cent as it closed at 4034.92 points, followed by BSE
TECk at 2.22 per cent (2745.43 points) and BSE HC at 1.56 per cent
(38947.84 points).
During
the week, the FIIs have turned net buyers in the equity market to the
extent of Rs 2,093.7 crore with purchases worth Rs 16,473.3 crore and
sales of 14,379.6 crore. Meanwhile, for the month of April, the FIIs have
been net buyers to the tune of Rs 521.9 crore with purchases worth Rs
44,644.8 crore and sales of Rs 44,122.7 crore.
Likewise,
the mutual funds have also been net buyers in the equity market to the
extent of Rs 1143.86 crore with purchases worth Rs 3770.56 crore and sales
of Rs 2626.7 crore. During the month of April, the mutual funds have been
net buyers ,
Derivatives
The
NSE’s F & O segment continued to witness an increase in its turnover
with the weekly turnover rising to Rs 259,464 crore from Rs 201,273 crore
in the previous week. As usual stock futures has continued to contribute
the bulk of the trading at Rs 158,201 crore, while the index futures stood
at 77,532 crore.
Government
Securities Market
Primary
Market
During
the week, the RBI has conducted auction of 7.40 per cent 2012 paper and
7.95 per cent 2032 paper for a notified amount of Rs 6,000 crore and Rs
4,000 crore, respectively. The cut-off yield for 7.40 per cent 2012 paper
has been 7.0604 per cent and for 7.95 per cent 2032 paper has been 8.0038
per cent. Meanwhile, RBI has mopped up Rs 750 crore and Rs 1300 crore
through 91-day and 364-day treasury bills, respectively; the cut-off
yields for 91-day and 364-day treasury bill were 5.4065 per cent and
5.9035 per cent, respectively.
Meanwhile,
RBI has also conducted the auction of Kerala SDL 2016 for a notified
amount of Rs 300 crore and the cut-off yield has been set at 7.65 per
cent. Also, RBI has fixed the rate of interest on floating rate bonds,
2016 at 6.15 per cent per annum applicable for the year (May 7, 2006 to
May 6,2007). The RBI has also announced sale (re-issue)) of 7.59 per cent
2016 and 7.50 per cent 2034 paper for a notified amount of Rs 6,000 crore
and Rs 4,000 crore, respectively on May 4,2006.Secondary
Market
During
the week, rising international crude oil prices and concerns over the
Bond
Market
During
the week, the corporate bond yields has risen as robust US economic data,
rise in the global crude oil prices, and the dated securities auction in
the market weighed down the corporate bond market.
Foreign
Exchange Market
In
the forex market, the rupee began the week on a firm note, breaching the
Rs 45 mark on dollar’s weakness in the overseas market and absence of
dollar buying from the PSU banks. However, month-end dollar demand, rising
international crude oil prices and RBI intervention has kept the rupee
under pressure. The rupee stood 0.38 per cent firm at Rs 44.97 per dollar
against Rs 45.14 over the week. In the forward premia market the premiums
rose despite spot rupee’s rise, the six-month annualised premia closed
at 1.24 per cent on April 28 as compared to 0.99 per cent on April 21.
Commodities
Futures Derivatives
During
the week, the commodity futures trading has witnessed high volatility with
the prices of domestic rubber witnessing a correction given the uncertain
and weak overseas sentiments as well as absences of buyers at the higher
levels of trading. Inspite of the continued support given by the major
manufactures of sheet rubber, the price of RSS 3 has fallen in the week.
On the other hand, trading in pepper has registered a decline on account
of the huge warehouse stocks in godown across the country.
Meanwhile,
on April 25, the FMC has classified real time trading in a commodity by
opening the terminals of foreign commodity exchanges without prior
approval of the Centre or FMC, as illegal and punishable. It further
clarified that forward contracts, other than those that are a) entered
into between members of recognised association or through or with such
members in goods that are notified under Section 15; b) complying with the
by-laws of recognised exchanges and c) not in violation of any contract
specification, would be considered illegal and void.
The NCDEX is planning to launch trading in aluminium, zinc, and nickle by the first week of May, thus strengthening its position in the non-ferrous metal trading segment. The contract size for aluminium and zinc is two tonne and for nickel 250 kg; the contracts would be settled on the basis of spot prices in the international markets.
CREDIT
RATING
Icra
has assigned an ‘LAAA (SO)’ rating to the Rs 3120.3 million series A
pass through certificates (PTCs) under securitisation issue backed by
residential mortgage backed receivables originated by Standard Chartered
Bank. The
rating for the PTCs are based on the strength of cash flows from the
selected pool of contracts; the available credit enhancement in the form
of cash collateral and the integrity of the legal structure.
Icra
has assigned ‘A1+’ rating for the Rs 1,000 million short-term debt
programme of TGS Investment and Trade Private Limited (TGS). The assigned
rating factors in TGS’s strong parentage and the financial flexibility
enjoyed by the company by virtue of it being part of the AV Birla group.
The rating also factors in the strong liquidity position of the company
backed by the market value of holdings in listed group entities and the
strategic holdings of non-listed companies in various AV Birla group
companies.
Icra
has reaffirmed the ‘LAA +’ rating assigned to the Rs. 4.5 billion
non-convertible debenture programme of Tata Motors Limited (TML). The
agency has also re-affirmed the ‘LAA+’ rating for the Rs. 2.5 billion
non-convertible debenture programme of TML. The rating reaffirmations take
into account TML’s market leadership status in the domestic commercial
vehicle (CV) segment, its strong position in the domestic passenger car
segment, besides its favourable cost structure, strong working capital
management and comfortable capital structure.
Icra
has placed the ‘LA’ rating assigned to the Rs. 10 crores
non-convertible debenture programme of Karvy Consultants Limited (KCL) on
rating watch with negative implications. The positive outlook assigned to
the rating has been withdrawn. The rating action factors in the business
and financial risk uncertainties associated with KCL following the SEBI
order in the matter of investigations into initial public offerings, which
restrains KCL from various capital market related business. ![]()
CORPORATE
SECTOR
Construction
and engineering major Larsen and Toubro has secured Rs 800 crore contract
from Reliance Industries Limited for construction services and supply of
electrical systems for its special economic zone refinery and
petrochemicals project in Jamnagar, Gujarat. The construction division of
the company will undertake critical civil, mechanical and electrical works
for the 29 million tonne per year refinery and petrochemical complex.
UltraTech
Cement has reported 31 per cent rise in net sales to Rs 1,022 crore for
the quarter ended March 2006 and almost 17 times-increase in its net
profits to Rs 82 crore compared with Rs 5 crore in the same period
previous year.
ABB
has posted 32 per cent rise in net sales for the first quarter ended March
2006 to Rs 820.9 crore and 87 per cent increase in net profit to Rs 51.3
crore over the same period a year ago.
Rolta
HCL
Infosystem’s gross sales for the quarter ended March 2006 have increased
by 60 per cent to Rs 3211.20 crore over the corresponding period a year
ago. The company has registered 29 per cent jump in net profit to Rs 84.44
crore. Its revenue from the computer systems business has moved up by 27
per cent to Rs 682.21 crore.
Indian
Petrochemicals Corporation (IPCL) has decided to merge six group companies
with itself. These are Apollo Fibres (AFL), Central India Polyester (CIPL),
India Polyfibres (IPL), Orissa Polyfibres (OPL), Recron Synthetics (RSL)
and Silvassa Industries (SIPL).
Gujarat
Gas Company has posted net profit of Rs 24.47 crore for the first quarter
ended March 2006, down by 10.46 per cent over the same period a year ago.
The company’s total income has increased by 26.7 per cent to Rs 202.88
crore.
Mukesh
Ambani controlled Reliance Industries Limited (RIL), which is diversifying
into retail sector, will set up as many as 52 rural hubs in Punjab at a
cost of Rs 6,000 crore, Out of these 52, as many as six would become
operational by January next year (2007). These rural hubs will have
facilities like pesticides sales centres, purchase centres and other
extensive services required by the villages.
Reliance
Industries group company Reliance Gas Pipeline Limited (RGPL) will set up
a pilot project with an investment of Rs 30-35 crore in Shahdol in Madhya
Pradesh. The company will lay a 15-kilometer gas pipeline and will supply
gas to companies like Orient Paper Mills, local units in Shahdol and power
plants situated closeby.
Nicholas
Piramal India (NPIL) has posted a growth of 57.3 per cent in its net sales
in the fourth quarter ended March 2006 at Rs 336.19 crore over the same
period a year ago. The company has recorded a net profit of Rs 37.59 crore
compared with a net loss of Rs 12.48 crore in the same quarter of the
previous year. For the year ended 31 March 2006, NPIL’s net profit has
marginally gone up to Rs 170.35 crore from Rs 169.57 crore.
During
January-March 2006, Cipla has posted 80 per cent increase in net profit to
Rs 190.77 crore over the corresponding quarter previous year. Total income
has increased by 66 per cent to Rs 917.35. For the financial year ended
March 2006, the company has recorded a growth of 46 per cent in net profit
at Rs 600.08 crore.
FMCG
major Dabur
Colgate
Palmolive (
JK
Paper has registered about 8 per cent increase in net profit to Rs 8.65
crore for the third quarter ended March 2006 over the corresponding period
previous year.
Maruti
Udyog Limited has recorded 7 per cent rise in net sales to Rs 3,260 crore
for the quarter ended March 2006 and net profit has augmented by 39 per
cent to Rs 360 crore over the same period previous year. Domestically,
during the quarter ended March 2006, the company has sold 1.46 lakh units
of vehicles as against 1.35 lakh units over the previous year and it has
exported 8,125 units of vehicles as against 10,941 units.
MRF
has reported 648 per cent jump in its net profit to Rs 5.84 crore for the
second quarter ended March 2006.
For
the quarter ended March 2006, Adlabs Film’s net sales have stood at Rs
34.33 crore, 53 per cent higher than the previous year and net profit has
risen by 31 per cent to Rs 8.07 crore. For the year ended March 2006,
Adlabs Films has posted a 24.67 per cent increase in net profit at Rs
26.30 crore over a year ago.
Dhampur
Sugar Mills has reported a whooping 230 per cent increase in net profit in
the second quarter of sugar year 2006-07 (October-September) to Rs 66.4
crore.
Siemens,
manufacturer of power equipment, has reported 72 per cent growth in net
profit at Rs 117.8 crore for the second quarter ended March 31, 2006 on
the back of new orders and strong exports. New orders for the second
quarter jumped by 72 per cent to Rs 1,591 crore. Demag Delaval Industrial
Turbomachinery, a 100 per cent subsidiary of the company, and Siemens VDO
Automotive had amalgamated with the company on November 17, 2005 and
January 19, 2006.
Bharat
Petroleum Corporation has posted net profit of Rs 1,788 crore for the
quarter ended March 2006, up 408 per cent over the corresponding quarter a
year ago.
Burdened
by higher oil subsidy, Gas Authority of India Limited (GAIL) has witnessed
a 22 per cent decline in net profits to Rs 409 crore for the quarter ended
March 2006. The subsidy burden shared by GAIL to compensate oil marketing
companies for selling kerosene and domestic cooking gas below cost has
doubled to Rs 538 crore during the quarter compared with Rs 237 crore
previous year.
Reduction
in freight rates has pulled down net profit of Great Eastern Shipping
Company by 11.37 per cent to Rs 223 crore in the quarter ended March 2006
as compared to the corresponding previous period's Rs 251.7 crore.
Hindustan
Zinc's net sales have surged by 142 per cent for the quarter ended March
2006 to Rs 1,774 crore over the same period previous year and net profit
has enhanced by 250 per cent to Rs 802 crore. For the financial year ended
March 2006, the company's refined zinc production for the year has stood
at 2,84,000 tonne or 2.8 lakh tonne, 34 per cent higher than the previous
year.
Hindustan
Lever Limited (HLL), the country's leading fast-moving consumer goods
company, has reported 11.6 per cent increase in net sales to Rs 2,798
crore for the quarter ended March 2006. HLL, which owns popular FMCG
brands like Surf, Lux, has registered a growth of 77 per cent in net
profit at Rs 442.86 crore for the quarter ended March 2006. HLL's
advertising and promotion spending for the quarter has significantly
higher by 45 per cent at Rs 303.34 crore.
Kochi
Refineries has posted a net loss at Rs 9.8 crore in the fourth quarter
ended March 2006, as against a net profit of Rs 224.8 crore for the
corresponding period in 2004-05. For the year ended March 2006, the
company’s net profit has declined by 75 per cent to Rs 210.8 crore as
compared with Rs 842.1 crore in 2004-05.
Wockhardt
has reported a net loss of Rs 3.7 crore in the first quarter ended March
2006 compared with net profit of Rs 41.7 crore in the corresponding period
of the last year.
Global
IT services provider Patni Computer Systems has posted 7.7 per cent drop
in net profit to Rs 64.24 crore in the first quarter ended March 2006 over
the comparable period of the previous year.
Indian Petrochemicals Corporation (IPCL) has registered a fall of 25.89 per cent in net profit to Rs 249 crore for the quarter ended March 2006. The petrochemical business worldwide has affected by high crude oil and natural gas prices leading to increase in cost of raw materials and reduction in profitability. On the raw-material side, price of naphtha and propane has higher by 27 per cent and 14 per cent, respectively.
LABOUR
After
the government decided to take recourse to legislation to mandate job
quotas in the private sector, the Confederation of Indian Industry (CII)
has made it clear that the mandatory reservations in any form is not
conducive to competencies and therefore, will not be acceptable. It
emphasised that since we are externally engaged economy, the multinational
companies may show disinterest to set up their bases in
The Labour Minister has ruled out the possibility of raising interest rate on the Employees’ Provident Fund (EPF) accounts from the 8.5 per cent announced earlier. He added that though the Finance Ministry has allowed 15 per cent investment of the EPFO’s corpus in equities and mutual funds, there is a difference of opinion on the issue in the EPFO’s Central Board of Trustees (CBT). Further, he mentioned that the Bill on providing social security to unorganised sector is likely to be introduced in the next parliament session.
INFORMATION
TECHNOLOGY
The
country’s largest software exporter, Tata Consultancy Services (TCS) has
planned a capital expenditure of Rs 1000 crore during the current
financial year. This includes investment on both technology and
infrastructure. The company’s aim is to become one of the top 10
companies globally by 2010. TCS is looking to expand in
HCL
Infosystem has announced 29 per cent rise in quarterly net profit to Rs
84.44 crore in the January-March 2006 quarter compared with Rs 65.40 crore
in the corresponding period of the previous year. The board has declared a
second quarterly dividend of 100 per cent on equity shares of face value
of Rs 2 each.
TELECOM
Confronted
with a severe capacity crunch, state-owned Mahanagar Telephone Nigam Ltd.
(MTNL) will soon expand its network by an additional 4 lakh GSM lines. The
company has awarded a contract for this purpose to US-based telecom
equipment vendor Motorola. The expansion cost for
![]()
|
Macroeconomic Indicators |
|
Table
1 : Index Numbers of Industrial Production (1993-94 =100) |
|
Table
2 : Production in Infrastructure Industries (Physical Output Series) |
| Table 3: Procurment, Offtake and Stock of foodgrains |
|
Table
4: Index Numbers of Wholesale Prices (1993-94 = 100) |
|
Table
5 : Cost of Living Indices |
|
Table
6 : Budgetary Position of Government of India |
|
Table
7 : Government Borrowing Programmes and Performance |
|
Table
8 : Scheduled Commercial Banks -
Business |
|
Table
9 : Money Stock : components and Sources |
|
Table 10 : Reserve Money : Components and Sources |
|
Table
11 : Average Daily Turnover in Call Money Market |
|
Table
12 : Assistance Sanctioned and Disbursed by All-India Financial
Institutions |
|
Table
13 : Capital Market |
|
Table
14 : Foreign Trade |
|
Table 15 : India's Overall Balance of Payments |
|
Table
16 : Foreign Investment Inflows |
| Table 17 : Foreign Collaboration Approvals (Route-Wise) |
| Table 18 : Year-Wise (Route-Wise) Actual Inflows of Foreign Direct Investment (FDI/NRI) |
|
Table
19 : NRI Deposits - Outstandings |
|
Table
20 : Foreign Exchange Reserves |
|
Table 21 : Indices REER and NEER of the Indian Rupee |
|
Table
22 : Turnover in Foreign Exchange Market |
| Table 23 : India's Template on International Reserves and Foreign Currency Liquidity [As reported under the IMFs special data dissemination standards (SDDS) |
| Table 24 : Settlement Volume and Netting Factor for Government Securities Transactions Settled at CCIL - Monthly, Quarterly and Annual Basis. |
| Table 25 : Inter-Catasegory Distribution of All Types of Trade in Government Securities Settled at CCIL (With Market Share in Respective Trade Types) |
| Table 26 : Category-wise Market Share in Settlement Volume of Government Securities Transactions (in Per Cent) |
| Table 27 : Settlement Volume and Netting Factor for Total Forex Transactions Settled at CCIL - Monthly, Quarterly and Annual Basis. |
| Table 28 : Inter-Category Distribution of Total Foreign Exchange Transactions Settled at CCIL (With Market Share in Respective Trade Types) |
![]()
|
Memorandum Items |
*These statistics and the accompanying review are a product arising from the work undertaken under the joint ICICI research centre.org-EPWRF Data Base Project.
We will be grateful if you could kindly send us your feed back at epwrf@vsnl.com